Marine Weather Review North Atlantic Area September through December 2009
George P. Bancroft, NOAA National Center for Environmental Prediction Center
Introduction
The period of September to December 2009 included a period of increasing activity of extratropical cyclones as late summer gave way to fall and then early winter. From September to late October cyclones traveled mainly in a northeastward direction from the U.S. East Coast or Atlantic Canada through the northeast Atlantic. As winter approached there was increasing high-latitude blocking high pressure forcing low pressure centers to move erratically or turn more to the southeast after initially tracking northeast over the north central waters. There were 17 cyclones producing hurricane force winds during the four-month period with most of them occurring in October and December. The months of October to December each produced one low with the central pressure below 960 hPa, fewer than in the Pacific. The most intense cyclone of the period for both oceans was the 942-hPa low occurring over the north central Atlantic early in December. This four-month period includes the peak of the Atlantic hurricane season in early September, but only one cyclone formed on OPC's oceanic analysis area (Grace in early October). Another tropical cyclone, Ida, approached from the Gulf of Mexico before merging with a front near the Gulf coast but likely contributed to the significant maritime event off the U.S. East Coast November 11-14. Other tropical systems occurred during the period but remained south of OPC's area. The QuikSCAT instrument failed on November 23, 2009. Scatterometer winds displayed in figures after that date are from ASCAT, the European scatterometer (Reference 1).
Tropical Activity
Tropical Storm Grace: Grace developed from a non-tropical low in an unlikely place, northeast of the Azores and well outside the tropics near 41N 20W at 0300 UTC October 5 with maximum sustained winds of 55 KT with gusts to 65 KT. Tropical Storm Grace then moved northeast in the warm sector of a complex low-pressure system to the north and west and became strongest six hours later, developing maximum sustained winds 60 KT with gusts to 75 KT. Weakening followed as the cyclone moved over cooler water and Grace became an extratropical gale when reaching 50N and approaching Ireland. Dissipation followed over southern England by October 7.
Other Significant Events of the Period
Northeastern Atlantic Storm, September 6-9: Although it was still late summer on the calendar an unseasonably deep cyclone developed in the northeastern North Atlantic from late on September 6 to the 8th (Figure 1) aft er originating as a frontal wave of low pressure near the mid-Atlantic coast of the U.S. late on the 4th. The second part of Figure 1 shows the cyclone at maximum intensity with a central pressure down to 968 hPa. This was an early-season hurricane-force event with winds up to 70 KT showing up on QuikSCAT wind retrievals on the northwest side of the cyclone early on the 8th (Figure 2). THE SCHIEHALLION (MWYG6) near 60N 4W reported south winds of 50 KT at 1600 UTC on the 8th. The JAMES CLARK ROSS (ZDLP) encountered north winds of 45 KT and 5.0-meter seas (16 feet) at 0600 UTC on the 8th. The buoy 63115 (61.6N 1.3E) reported southwest winds of 40 KT and 5.2- meter seas (17 feet) on the 8th at 2000 UTC. Another buoy, 64046 (60.6N 4.9W) reported seas as high as 10.7 meters (35 feet) at 2000 UTC on the 9th after the cyclone began weakening and passing northeast of the area early on the 9th.
North Atlantic Storm, September 18-20: Another cyclone developed over the north-central waters during this period with the pressure as low as 974 hPa near 57N 38W at 1800 UTC on the 19th . It originated near the U.S. mid-Atlantic coast early on the 17th and developed storm force winds while passing east of the island of Newfoundland on the 18th. THE SAUDI HAIL (HZZF) reported southwest winds of 45 KT and 7.3-meter seas (24 feet) near 41N 50W at 1800 UTC on the 18th. The platform HIBERNIA (46.7N 48.7W) reported southeast winds of 68 KT and 2.5-meter seas (8 feet) at 1800 UTC on the 18th. Also at that time the HENRY GOODRICH (HP6038, 46.7N 48.4W) platform encountered southeast winds of 60 KT and 2.1-meter seas (7 feet) and the TERRA NOVA (VCXF, 46.4N 48.4W) southeast winds of 50 KT. The anemometer heights of those platforms are 139, 90 and 53 meters, respectively (Reference 3). The buoy 44636 (45.6N 56.1W) at 1200 UTC on the 18th reported southeast winds of 45 KT. The cyclone then passed northeast across Iceland and began weakening on the 20th.
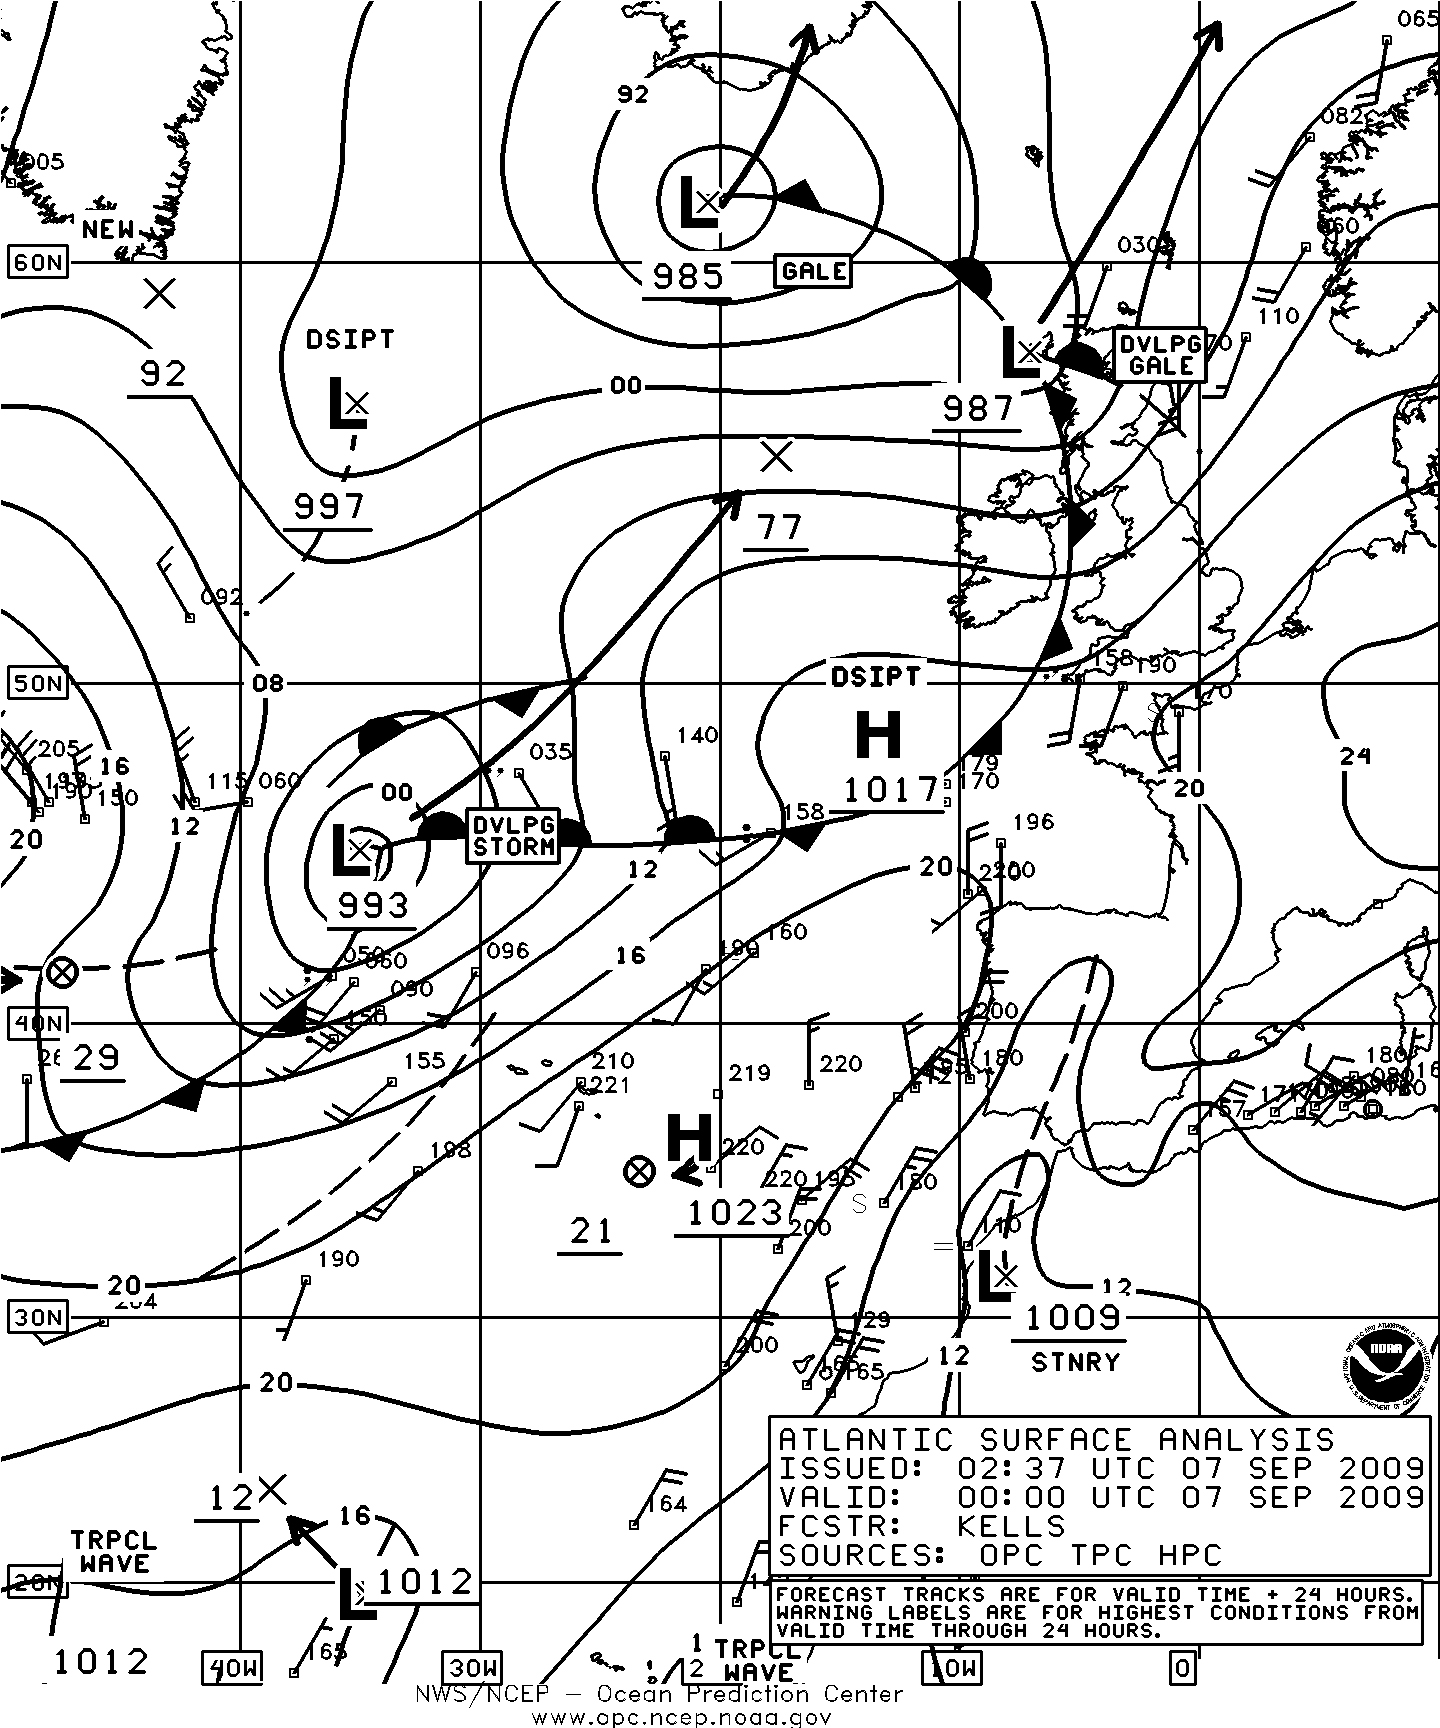
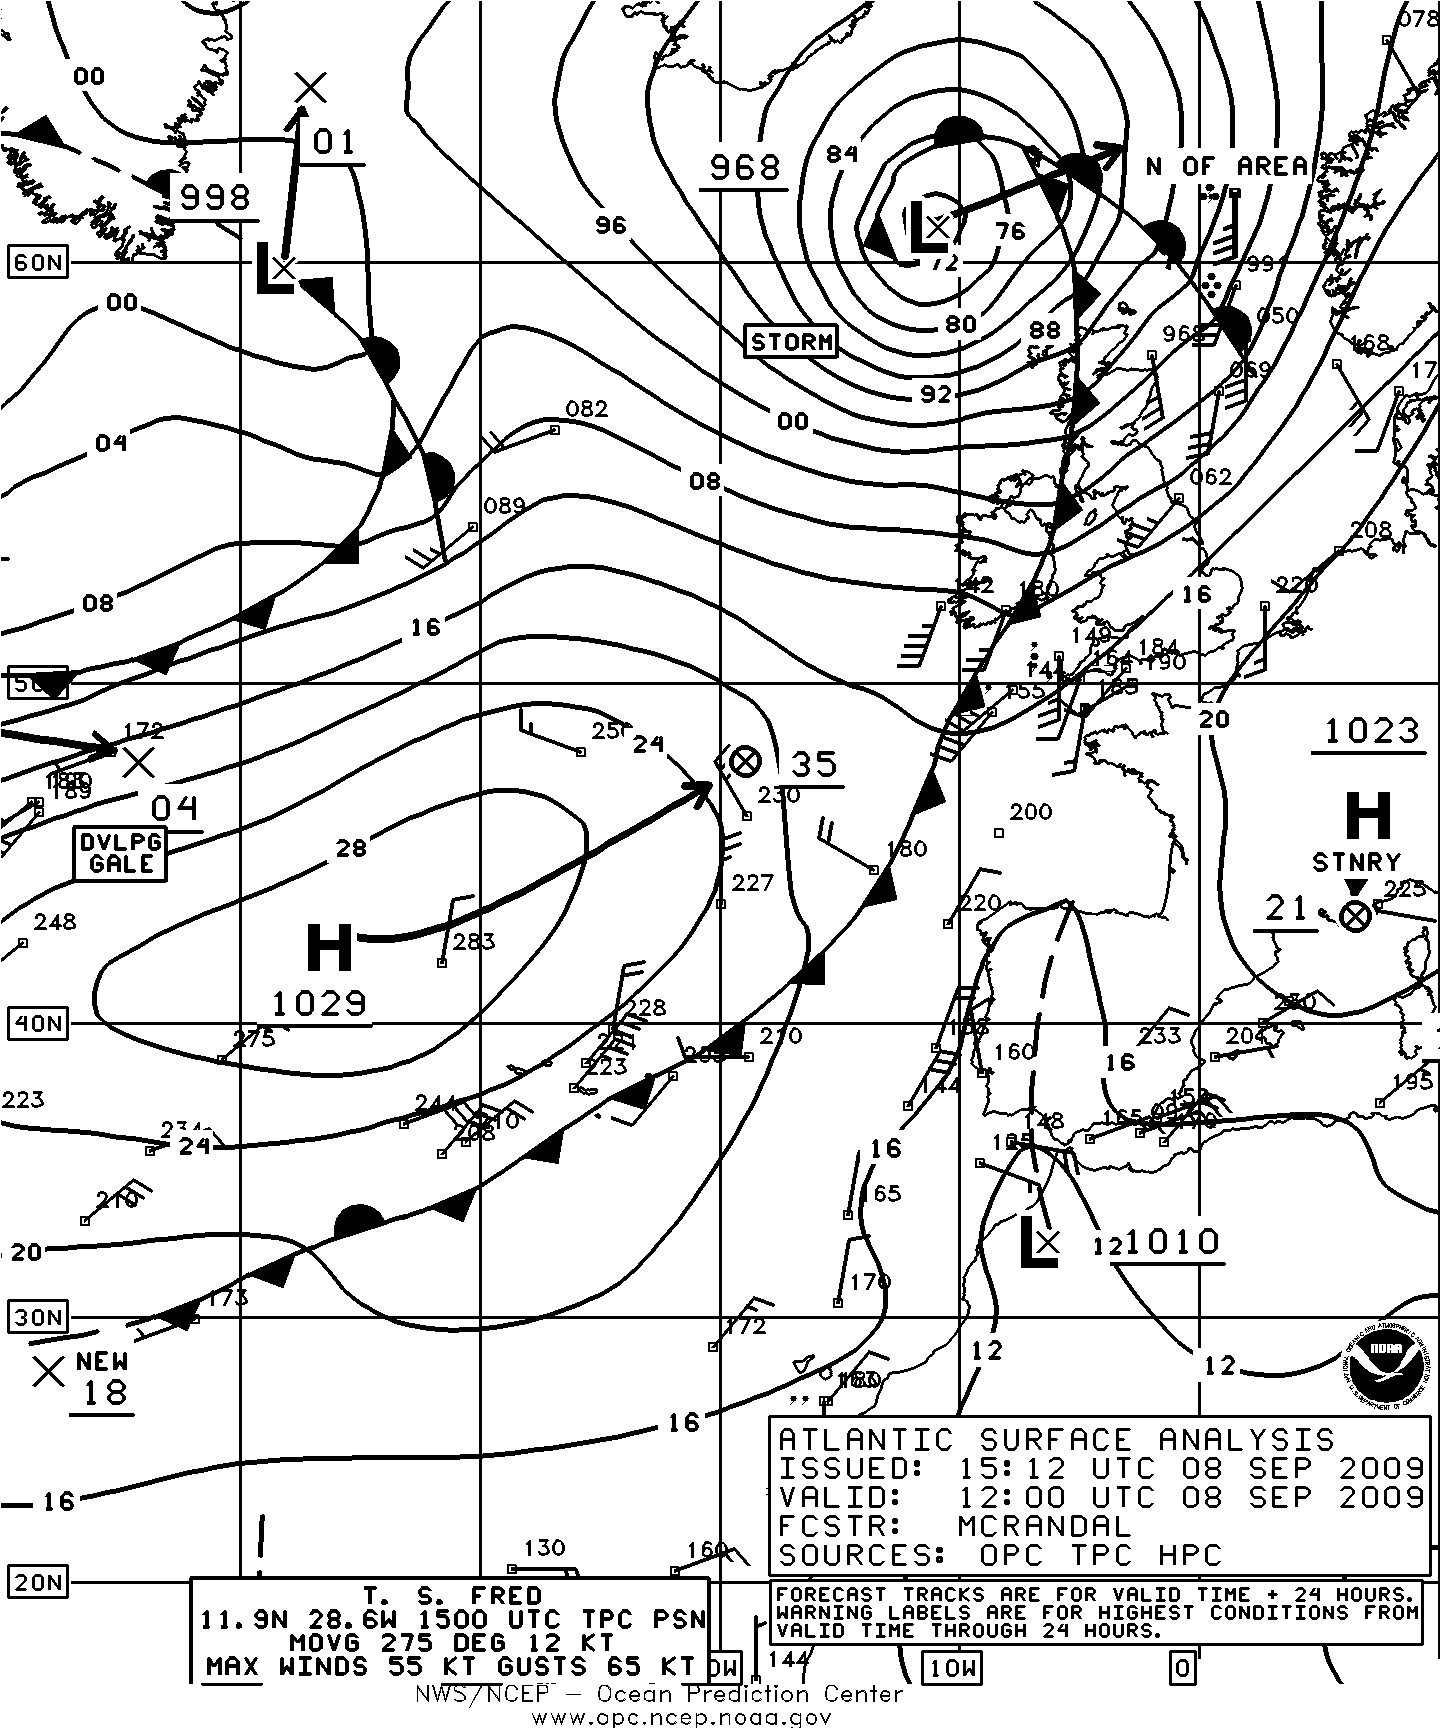
Figure 1. OPC North Atlantic Surface Analysis charts (Part 1 - east) valid 0000 UTC September 7 and 1200 UTC September 8, 2009. Twenty-four hour forecast tracks are shown with the forecast central pressures given as the last two whole digits in millibars.
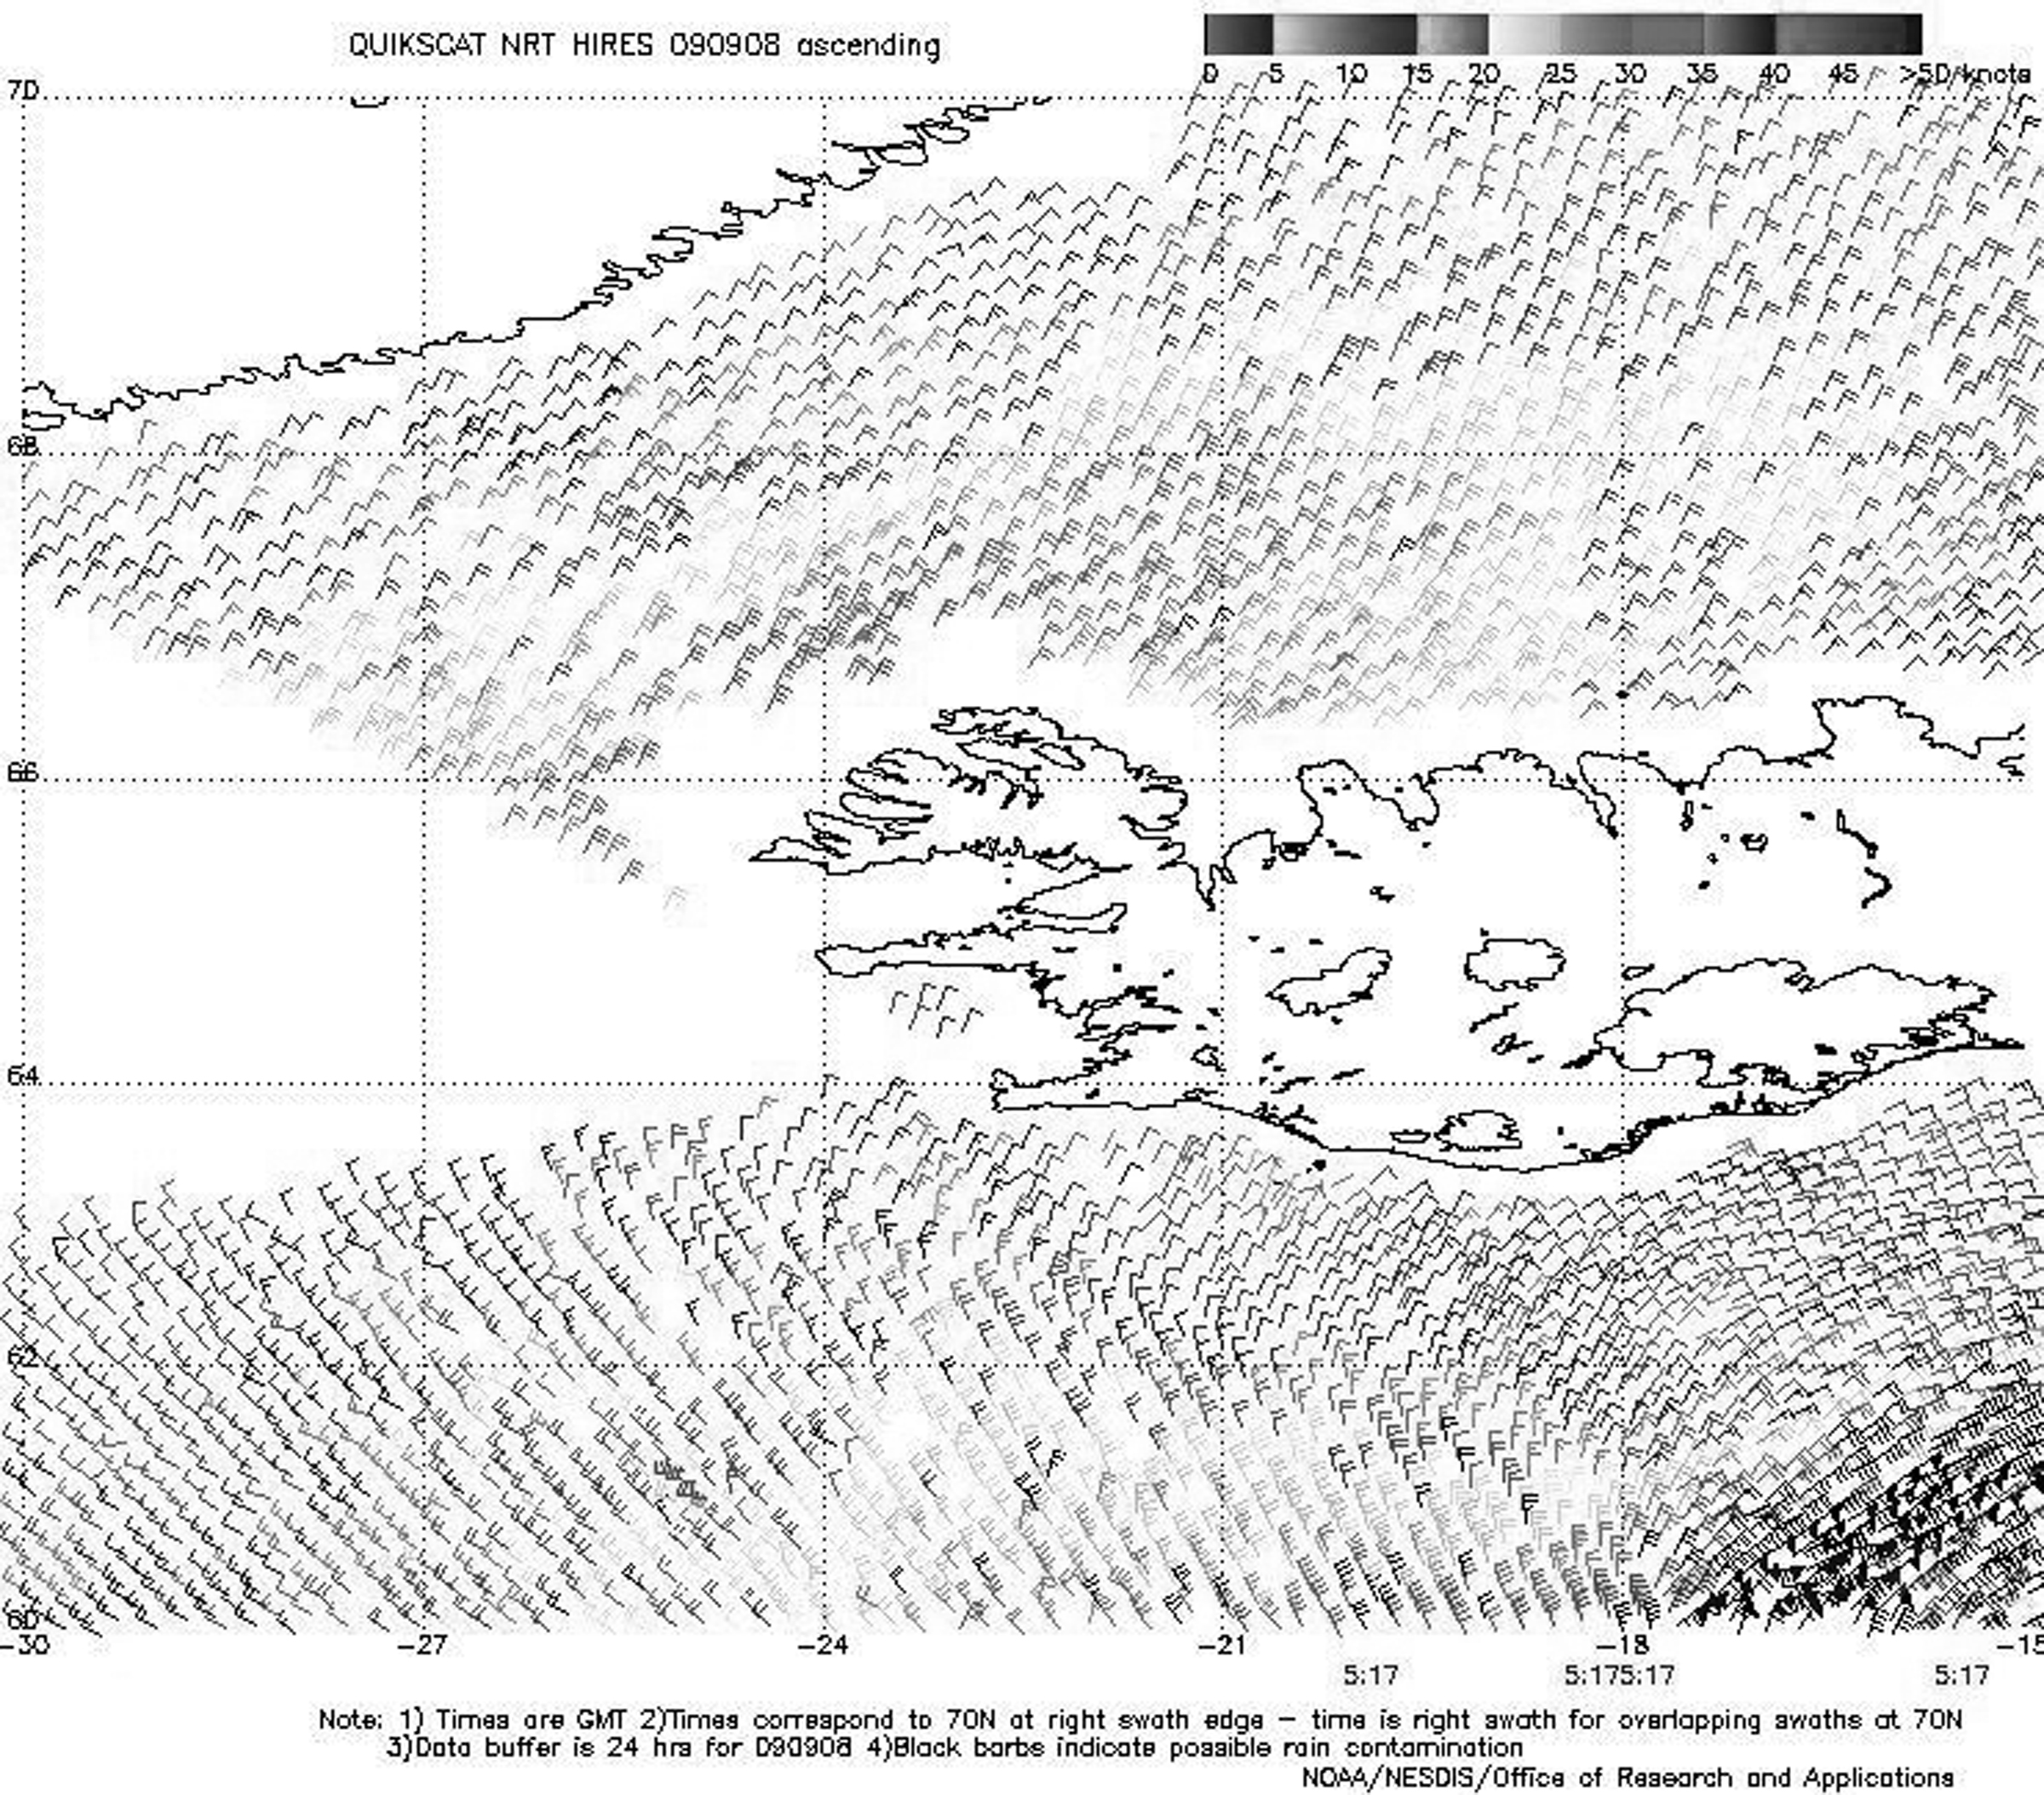
Figure 2. High-resolution QuikSCAT scatterometer image of satellite-sensed winds around the northwest side of storm shown in Figure 1. The valid time of the pass is 0517 UTC September 8, 2009 or about seven hours prior to the valid time of the second part of Figure 1. The center of the storm is just off the lower right corner of the image. The resolution of the image is 12.5 km versus 25 km in the standard version of the imagery. Image is courtesy of NOAA/NESDIS/Offi ce of Research and Applications.
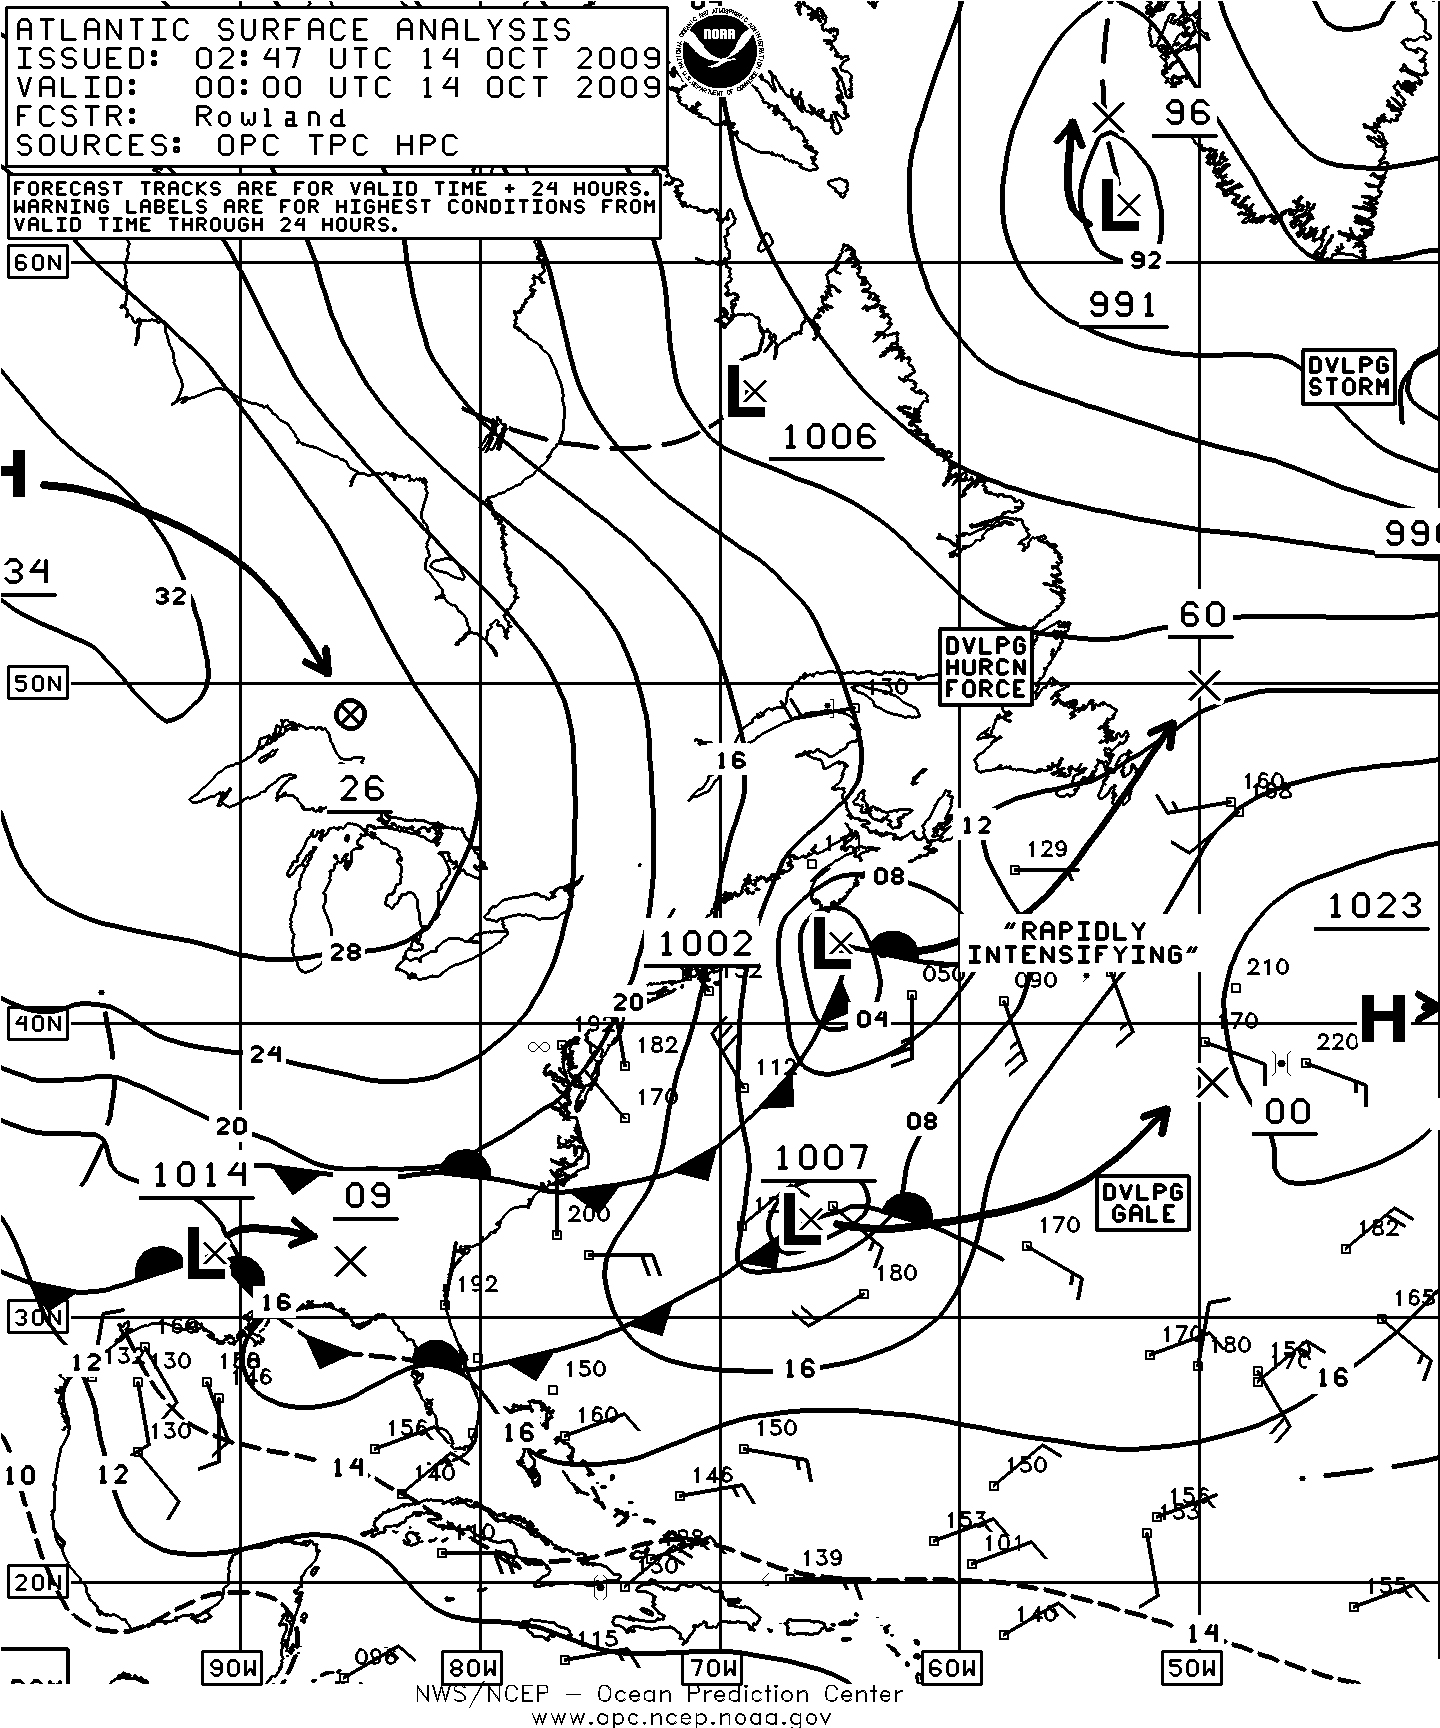
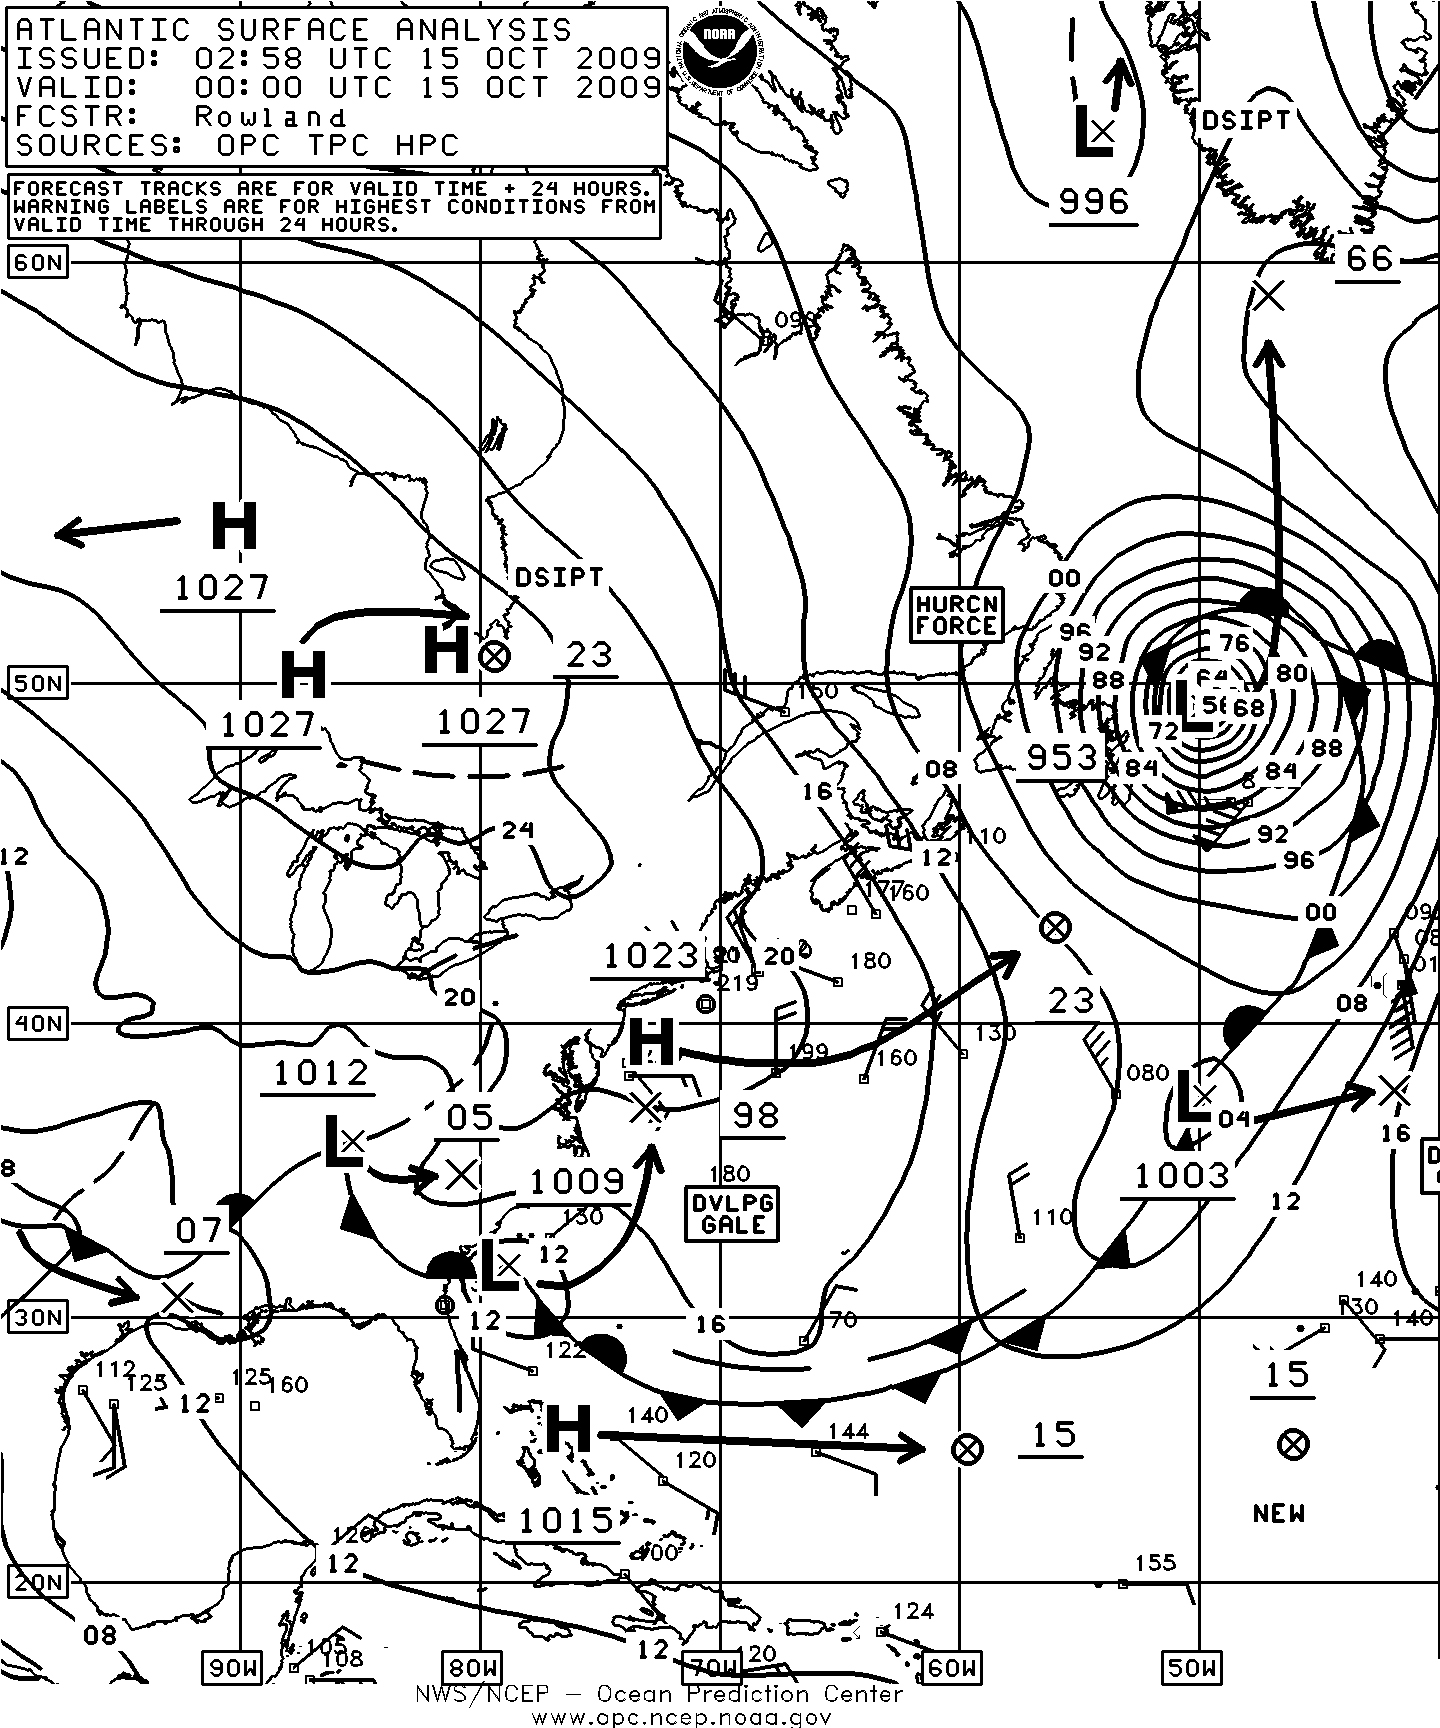
Figure 3. OPC North Atlantic Surface Analysis charts (Part 2 - west) valid 0000 UTC October 14 and 15, 2009.
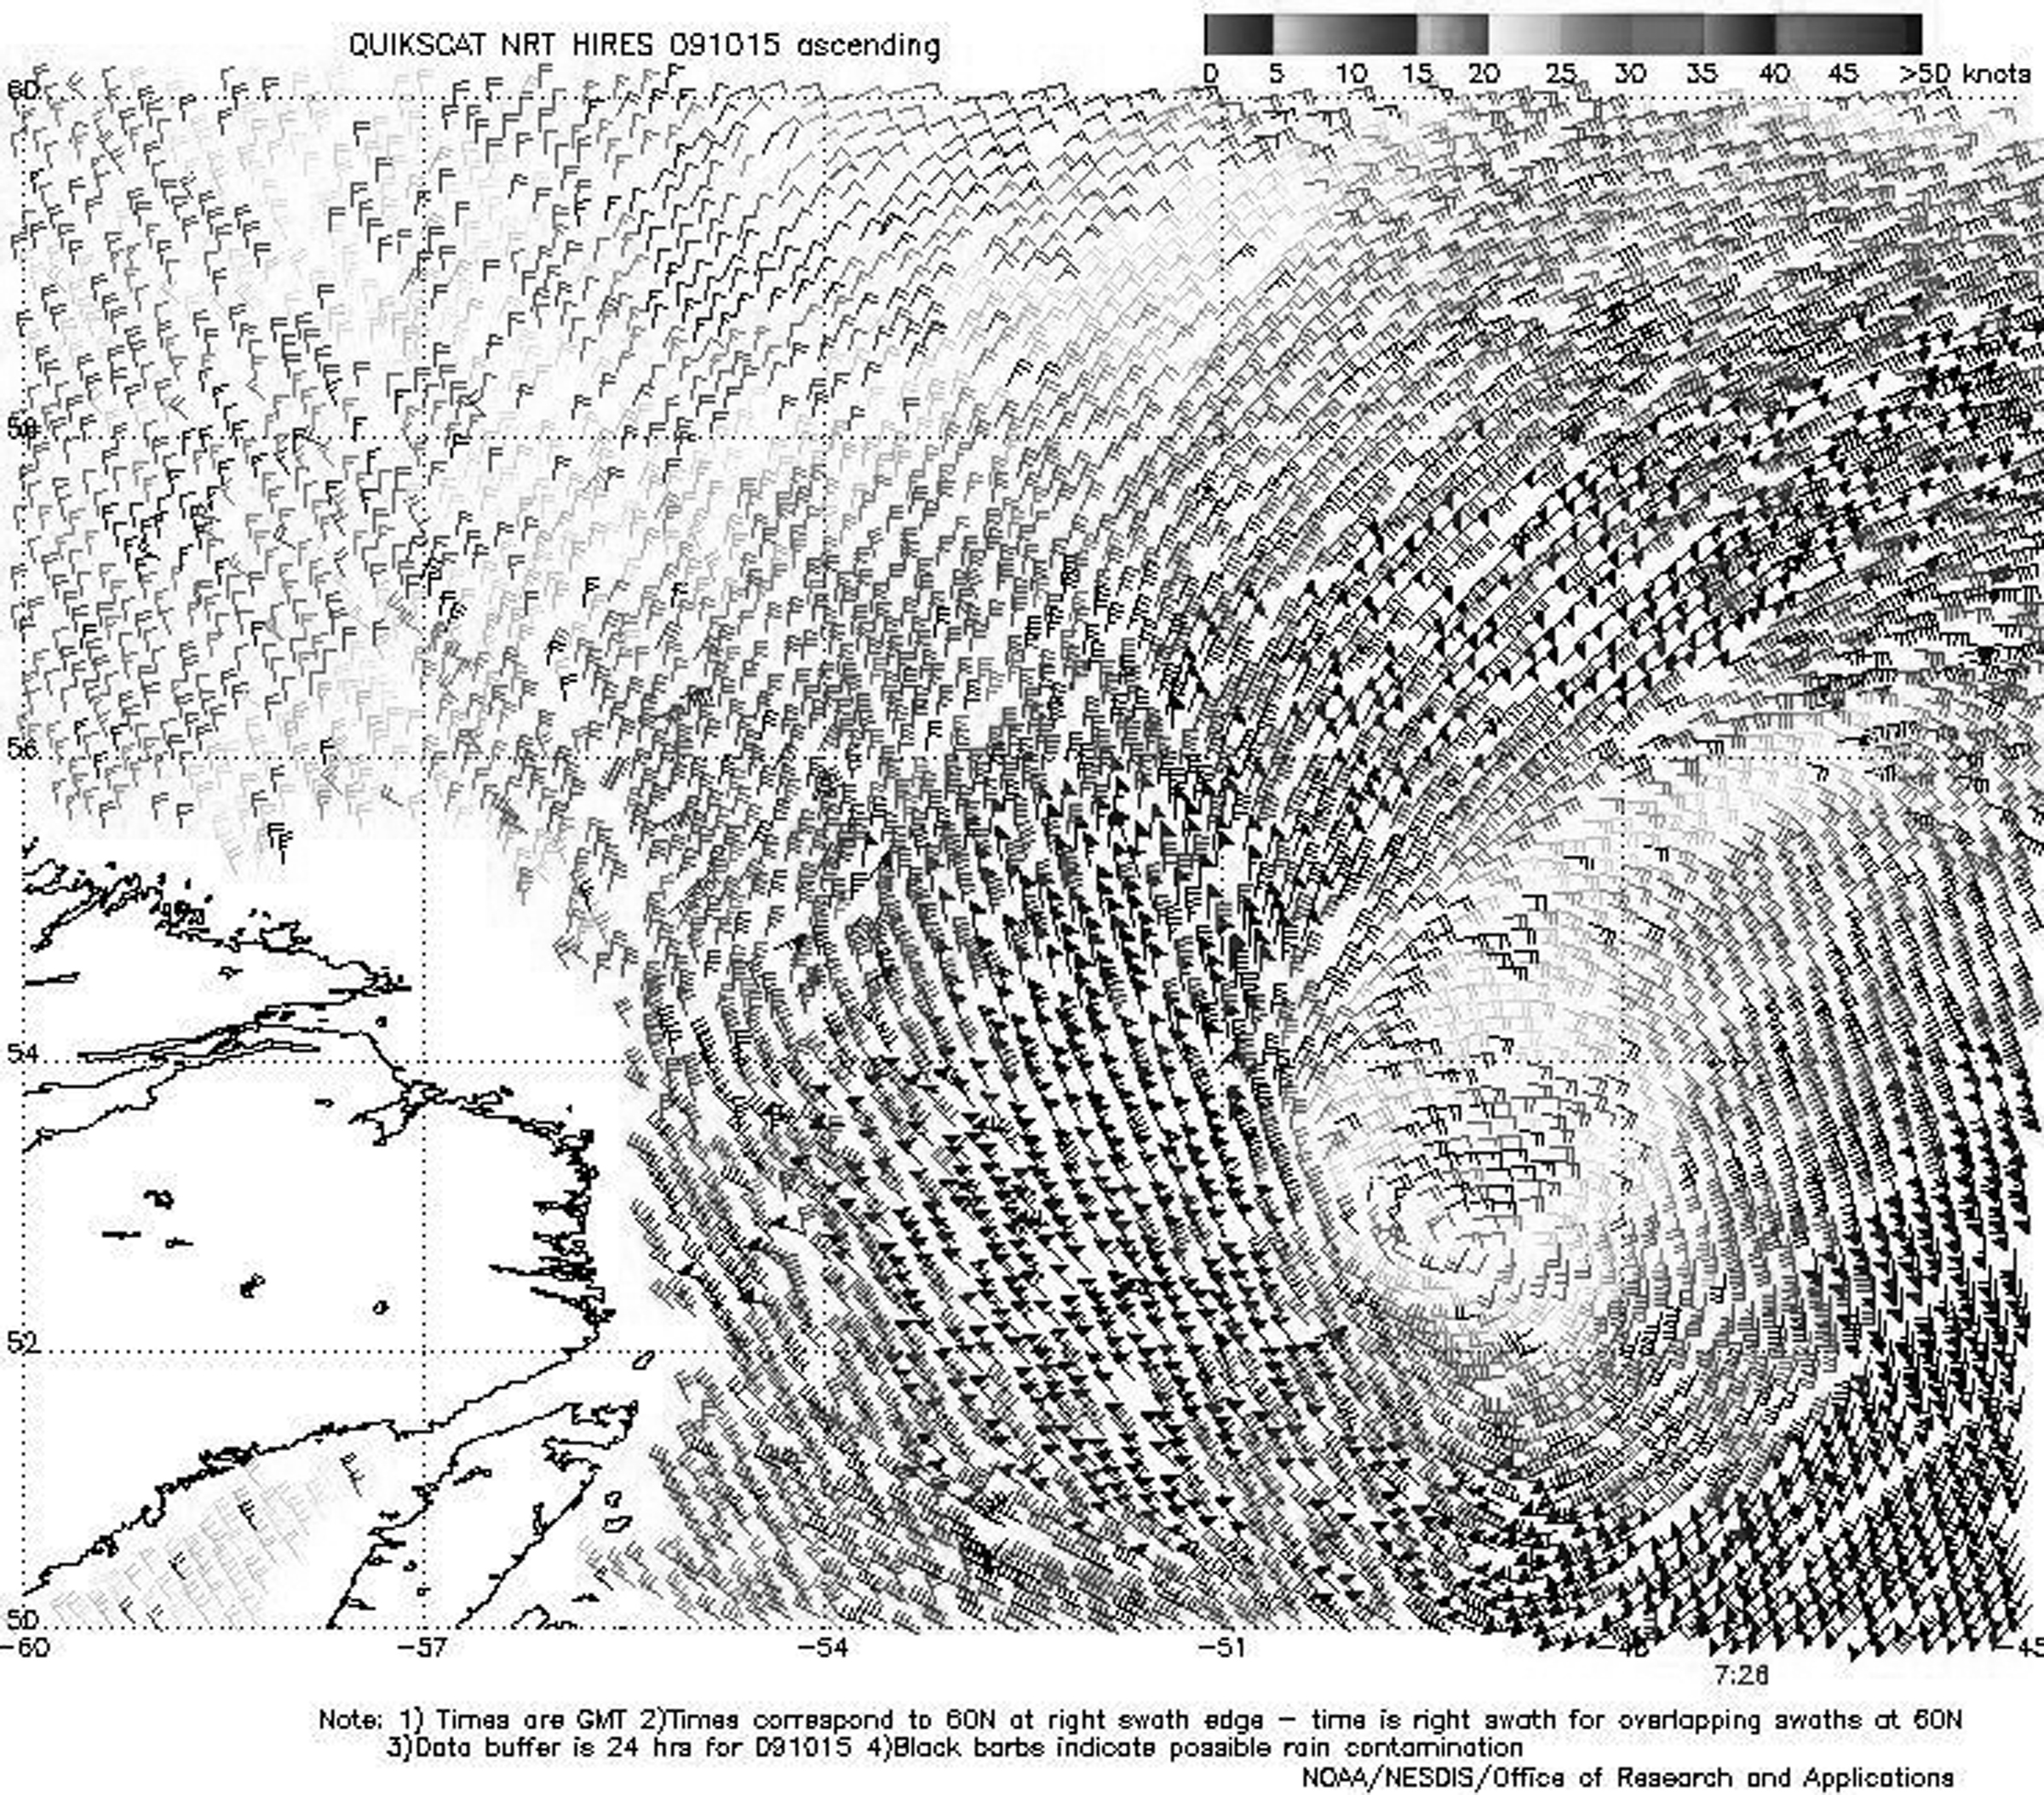
Figure 4. High-resolution QuikSCAT scatterometer image of satellite-sensed winds around the hurricane-force low shown in the second part of Figure 3. The valid time of the pass is 0726 UTC October 15, 2009, or about seven and one-quarter hours later than the valid time of the second part of Figure 3. The center of the storm is near 51N 49W in the lower-right portion of the image. Image is courtesy of NOAA/NESDIS/Offi ce of Research and Applications.
Northeastern Atlantic Storm, October 1-3: This cyclone unlike that of early September originated as a frontal wave of low pressure between Greenland and Iceland on October 1 and initially developed rapidly, passing just south of Iceland at 1200 UTC on the 2nd with a 985-hPa pressure, a drop of 30 hPa in pressure over the preceding twenty-four hour period. The cyclone developed a central pressure as low as 969 hPa and hurricane-force winds while passing just north of the British Isles early on October 3 and was otherwise similar to the early September event in intensity and winds by that time. The cyclone then quickly moved inland over Norway later that day.
North Atlantic Storm, Greenland Area, October 10-13: This cyclone originated over the Canadian Maritime Provinces early on October 8 and initially moved east over the central North Atlantic before turning north toward Greenland. The cyclone developed hurricane-force winds over the eastern Greenland waters as it made a loop just south of Greenland from the 11th to early on the 13th and developed a central pressure as low as 978 hPa. A high-resolution QuikSCAT pass early on October 12 revealed northeast winds to 70 KT in the Denmark Strait. The cyclone then weakened to a gale on the 13th while moving northeast through the east Greenland waters.North Atlantic Storm, October 14- 16: The next two significant events occurred in close succession. The stronger of these cyclones developed as shown in Figure 3, with the most rapid deepening occurring during this period, when the central pressure fell 49 hPa. The second part of Figure 3 shows the cyclone at maximum intensity, making it the second most intense storm of the period in the North Atlantic. The scatterometer winds in Figure 4 reveal a well-developed wind circulation with storm-force winds almost surrounding the center, and winds up to 75 KT southeast of the center. Hurricane force winds with this system lasted from late on the 14th to the morning of the 15th. As the cyclone headed north toward Greenland on the 15th a Jason-2 altimeter pass revealed seas as high as 54 feet (16. 5 meters) along the satellite track south of Greenland (Figure 5). Some ship and buoy observations taken in this storm are listed in Table 1. The cyclone subsequently weakened rapidly early on October 16 upon reaching southern Greenland and then passed northeast through the Denmark Strait late on the 16th.
North Atlantic Storm of October 15-21: After originating near the southeast U. S. coast late on October 14 this cyclone underwent initial rapid development while passing northeast off the U.S. mid-Atlantic coast and then south of the Canadian Maritime Provinces as shown in Figure 6, with the system briefly developing hurricane-force winds late on the 16th. Figure 7 is a high-resolution QuikSCAT pass from near the valid time of the first part of Figure 5 revealing gale to storm-force winds around the east semicircle of the low with some hurricane-force east winds noted on the northeast side. The cyclone then moved out over the North Atlantic and developed a lowest central pressure of 968 as depicted in the second part of Figure 6. It briefly developed hurricane-force winds again at that time, before turning east and weakening and then dissipating over Ireland on the 22nd. Selected ship and buoy reports from this storm are listed in Table 2.
North Atlantic Storm, October 23-26: The developing cyclone that followed took a more eastward track, moving east off Nova Scotia early on October 23 while rapidly intensifying, developing a lowest central pressure of 966 hPa near 45N 40W at 1200 UTC on the 24th. By this time the cyclone was similar in intensity to the late December event (Figures 18 and 19 except tracking 300 nmi to the north. The buoy 44141 (43N 58W) at 1500 UTC on the 23rd reported northwest winds of 45 KT and 6.0-meter seas (20 feet) and maximum seas 6. 7 meters (22 feet) four hours later. The platform HENRY GOODRICH (HP6038, 46. 7N 48. 4W) reported northwest winds of 65 KT and 4.5-meter seas (15 feet) at 1200 UTC on the 24th while the TERRA NOVA (VCXF, 46.4N 48.4W) nearby reported northwest winds of 50 KT. The cyclone subsequently turned northeast and weakened to a gale-force low near 50N 27W late on the 26th before redeveloping northward as a storm near Iceland on the 28th . The cyclone then turned west and then southwest toward the southern tip of Greenland and dissipated southeast of Greenland November 1.
| OBSERVATION | POSITION | DATE/TIME (UTC) | WIND | SEA (m/f) |
|---|---|---|---|---|
| Maersk Ohio (KABP) | 41N 42W | 15/0000 | S 45 | 11.5/38 |
| Hibernia (VEP717) | 46.7N 48.7W | 14/2100 | SW 87 | |
| Sea Rose (VOXS) | 46.7N 48W | 15/0000 | SW 85 | 9.4/31 |
| Henry Goodrich (HP6038) | 46.7N 48.4W | 14/1800 | SE 65 | |
| Terra Nova (VCXF) | 46.4N 48.4W | 14/2100 15/0600 | W 45 | 7.0/23 |
| Buoy 44251 | 46.4N 53.4W | 14/2000 14/2100 | NW 45 G56 | 5.0/16 |
| Buoy 44138 | 44.3N 53.6W | 14/1700 14/2000 | W 49 G60 Maximum | 6.5/21 7.5/25 |
| Buoy 44139 | 44.2N 57.1W | 14/1100 14/1300 | N 45 G56 Maximum | 4.0/13 6.0/19 |
| Buoy 44141 | 43N 58W | 14/1100 14/1400 | NW 41 G51 Maximum | 3.0/10 5.5/18 |
| OBSERVATION | POSITION | DATE/TIME (UTC) | WIND | SEA (m/f) |
|---|---|---|---|---|
| President Adams | 37N 63W | 16/1200 | SW 50 | 8.5/28 |
| (WRYW) | 36N 55W | 17/0600 | S 55 | 7.5/25 |
| Elektra (SIWB) | 55N 32W | 19/0600 | NW 50 | |
| Theband | 43.9N 60.2W | 16/2100 | NE 52 G64 | 5.0/16 |
| Platform CFO383 | 17/0000 | Maximum | 7.0/23 | |
| Buoy 44008 | 40.5N 69.2W | 16/0700 16/0500 16/0900 | NE 37 G49 Maximum Peak gust 51 | 5.0/16 6.5/21 |
| Buoy 44066 | 39.6N 72.6W | 16/0400 16/0500 | NE 35 G43 Maximum | 6.0/20 6.5/21 |
| Buoy 44024 | 42.3N 65.9W | 16/1400 17/0500 | NE 35 G45 Maximum | 6.5/21 7.5/25 |
| Buoy 44137 | 42.2N 62W | 16/1700 16/1900 | E 41 G52 Maximum | 6.5/21 7.5/25 |
| Buoy 44141 | 43N 58W | 16/2100 17/0400 | NE 39 G54 Maximum | 6.0/20 8.5/28 |
| Buoy 44636 | 44.1N 57.3W | 16/2000 | E 60 | |
| Buoy 44637 | 41.6N 56.9W | 16/1800 | SE 51 |
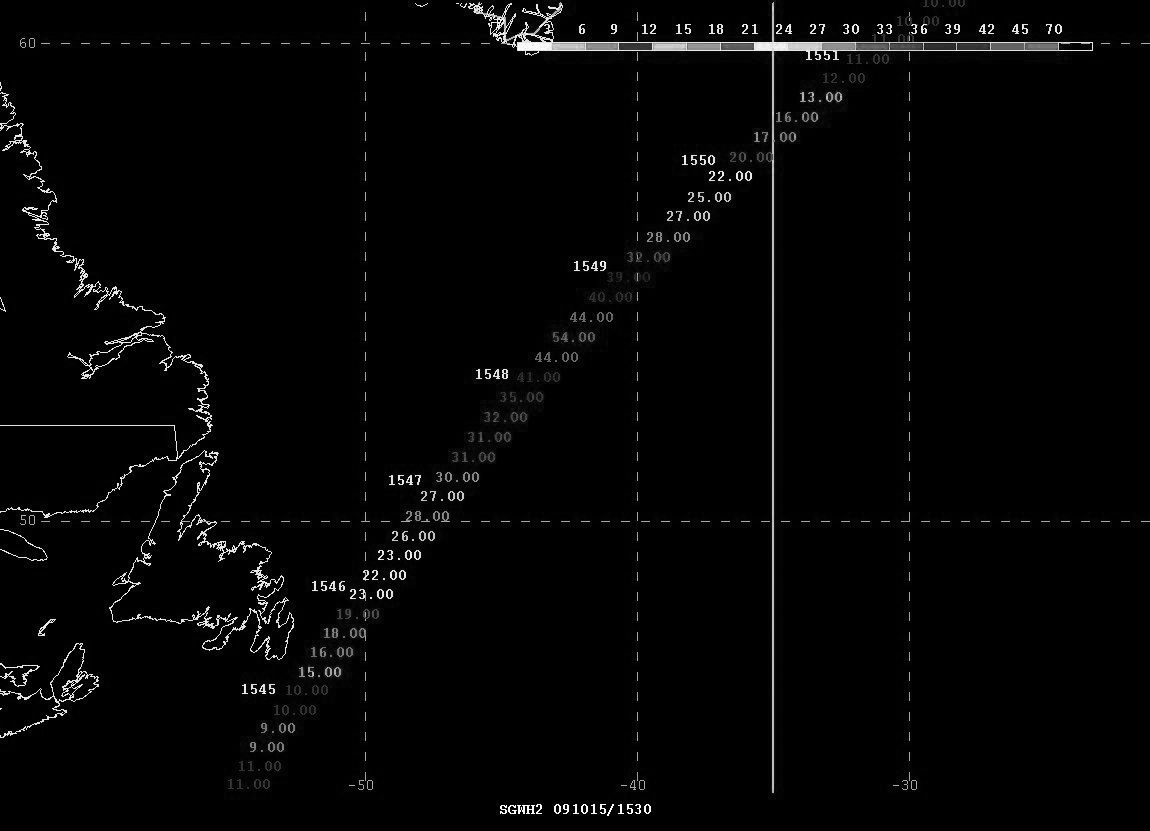
Figure 5. Jason-2 satellite altimeter pass from 1530 UTC October 15, 2009. The area of interest is the south and east sides of the hurricane-force cyclone moving north toward Greenland shown in Figure 3. The center of the storm was near 56N 49W at the time of the pass. The image shows a swath of observed wave heights (feet) along the track of the satellite with times at various points along the track given to the left of the track (UTC).
North Atlantic Storm, October 26-28: The development of this cyclone is depicted in Figure 8 as low pressure moving north into the Labrador Sea intensified into a storm before turning more southeast under the influence of high-latitude blocking which was becoming more common as winter approached. The cyclone turned southeast from the Labrador Sea on the 27th and developed hurricane force winds as depicted in the scatterometer winds of Figure 9. Some winds to 70 KT appear in the northeast flow south of Greenland and in the northwest flow off the southern Labrador coast. The platform SEA ROSE (VOXS, 46. 7N 47. 8W) at its 42-meter anemometer height reported northwest winds of 75 KT and 8.8-meter seas (29 feet) at 2000 UTC on the 27th. Seven hours later the platform HIBERNIA (VEP717, 46.7N 48.7W) reported northwest winds of 60 KT at its 139-meter anemometer height, and seas 7.0 meters (23 feet). At the same time the TERRA NOVA (VCXF, 46.2N 48.2W) reported northwest winds of 50 KT at its height of 53 meters. The WALTHER HERWIG III (60N 49W) encountered northwest winds of 45 KT at 1800 UTC on the 29th. The cyclone subsequently weakened to a gale as it turned east to near 50N 31W late on the 29th and then subsequently moved northeast across Scotland late on the 22nd and began to weaken, before moving inland. over Norway on November 23.
Atlantic storm of November 19-23, 2009: During the period of this major event a smaller but potent low-pressure system formed near 60N 30W at 0000 UTC on the 21st and moved northwest into the east Greenland waters (second part of Figure 12) where it briefly developed hurricane force north to northeast winds near the Greenland coast. A high-resolution scatterometer image from 2147 UTC November 21 revealed northeast winds to 70 KT in the Denmark Strait between Greenland and Iceland. The cyclone then made a cyclonic loop off the southern Greenland before dissipating near where it formed on the 23rd.
North Atlantic Storms November 19-23: Originating in the Hudson Strait area of northeastern Canada early on November 18, a developing cyclone passed southeast through the Labrador Sea to the north-central Atlantic waters on the 19th before turning more northeast toward Scotland and intensifying into a hurricane-force low on the 21st as depicted in Figure 12 which covers a sixty hour period. The second part of Figure 12 shows the cyclone at maximum intensity making it, along with the mid-October storm, the third deepest of the period. Figure 13 is a QuikSCAT image revealing a swath of west to northwest winds of storm-force or greater stretching from 30W almost to 15W including some 80-KT wind retrievals south of the center. Table 4 lists some notable observations from ships and buoys taken in this storm. The cyclone The cyclone subsequently moved northeast across Scotland late on the 22nd and began to weaken, before moving inland.
North Atlantic Storm, November 29-December 2: This cyclone moved off the Labrador coast on the 29th and tracked east-southeast and developed a lowest central pressure of 968 hPa near 55N 28W at 1200 UTC December 1. As the cyclone was already well-developed as it passed south of Greenland early on the 30th, imagery from the European scatterometer (ASCAT) revealed east winds to 55 KT on the north side where there was channeling against the southern ip of Greenland. Due to known low biases of the imagery versus QuikSCAT especially at high wind speeds it is likely that hurricane-force winds were occurring briefly as the intensifying low passed to the south. The cyclone was briefly classified by OPC as a hurricane-force low as the cyclone reached maximum intensity. Rapid weakening followed as the system approached Ireland by the 2nd with its winds lowering to gale force. The system crossed Great Britain on the 2nd before dissipating in the North Sea on the 4th.
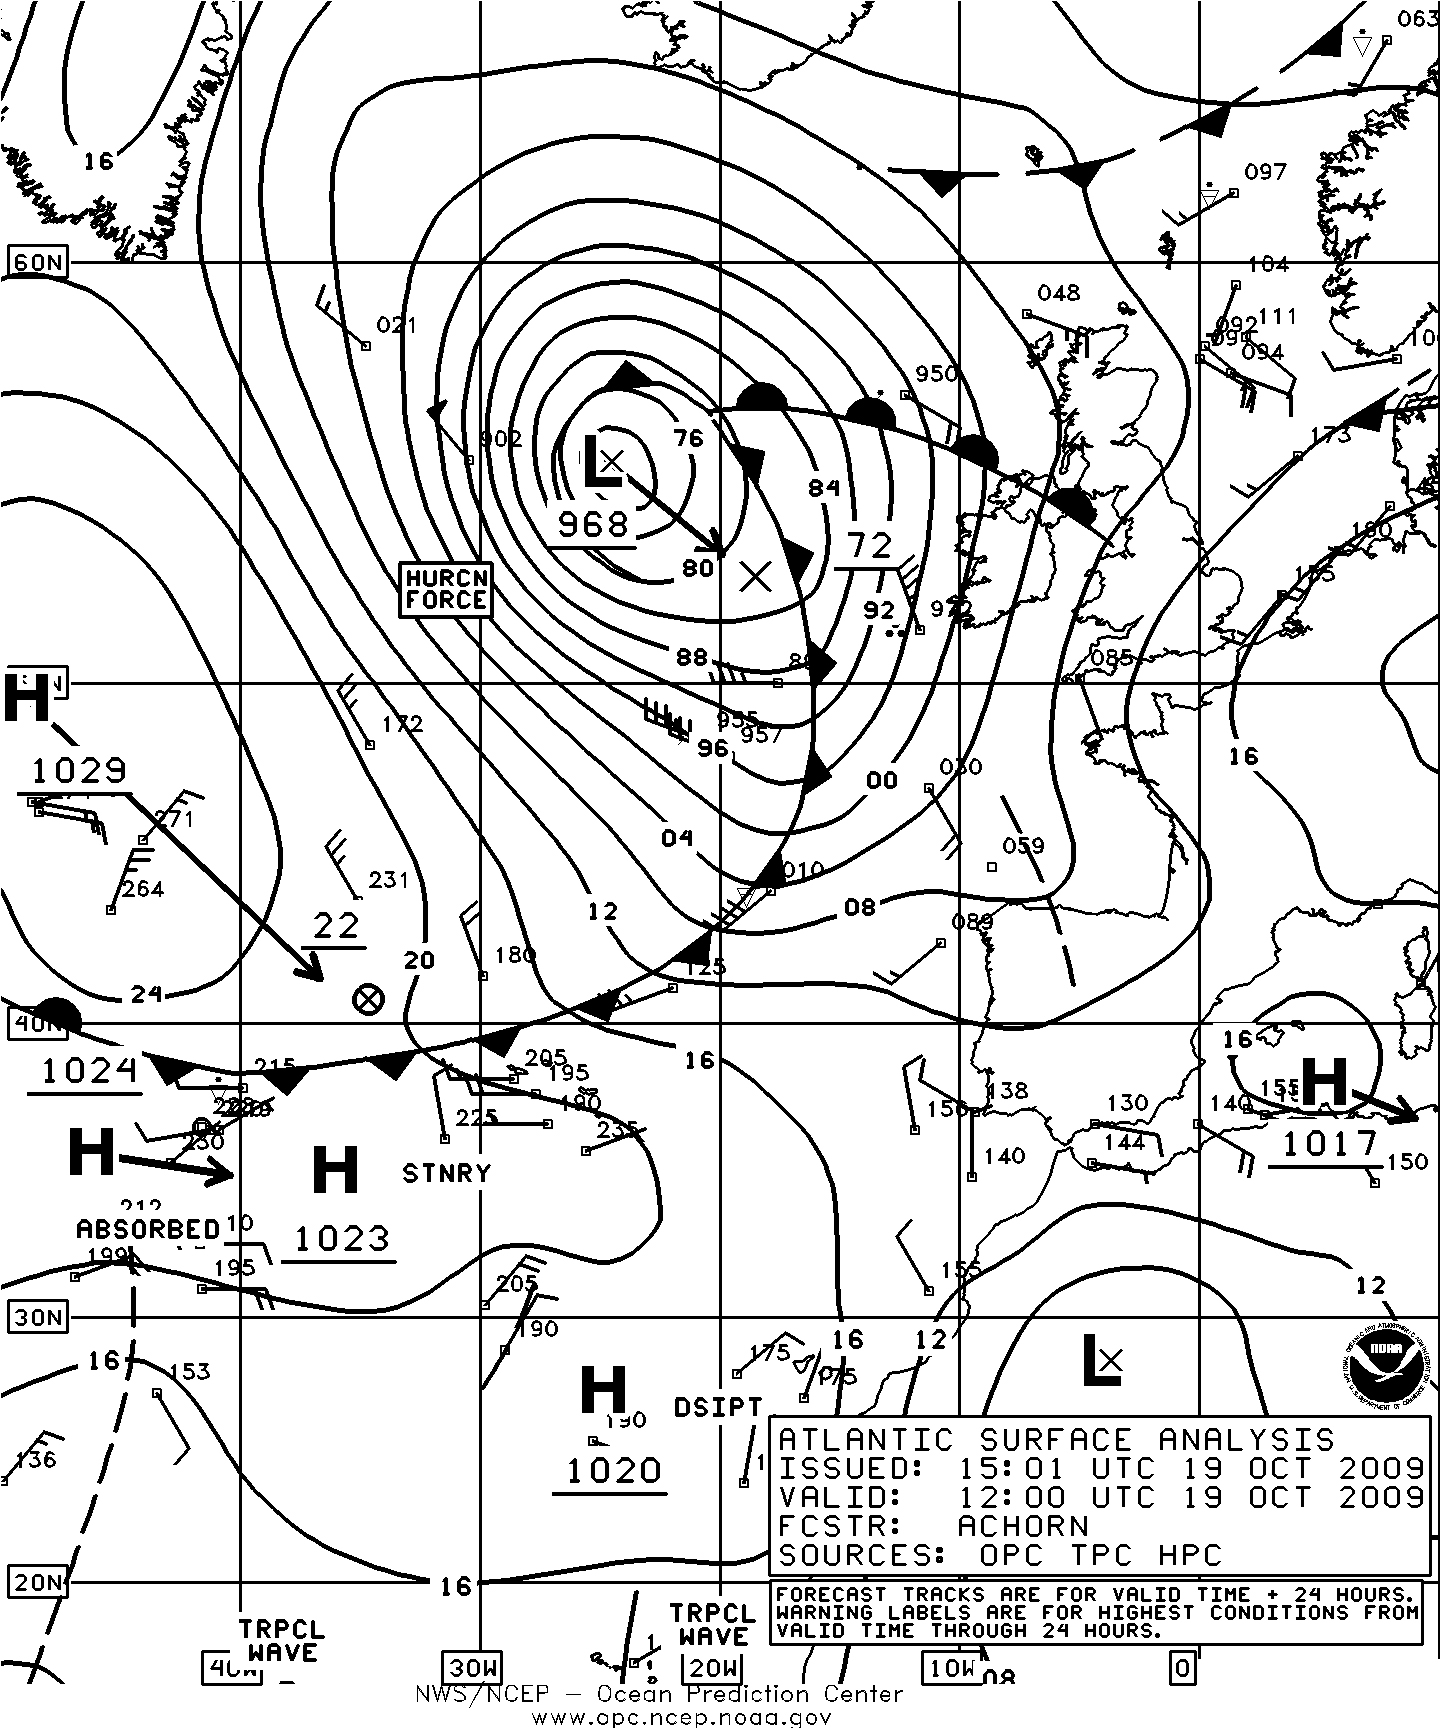
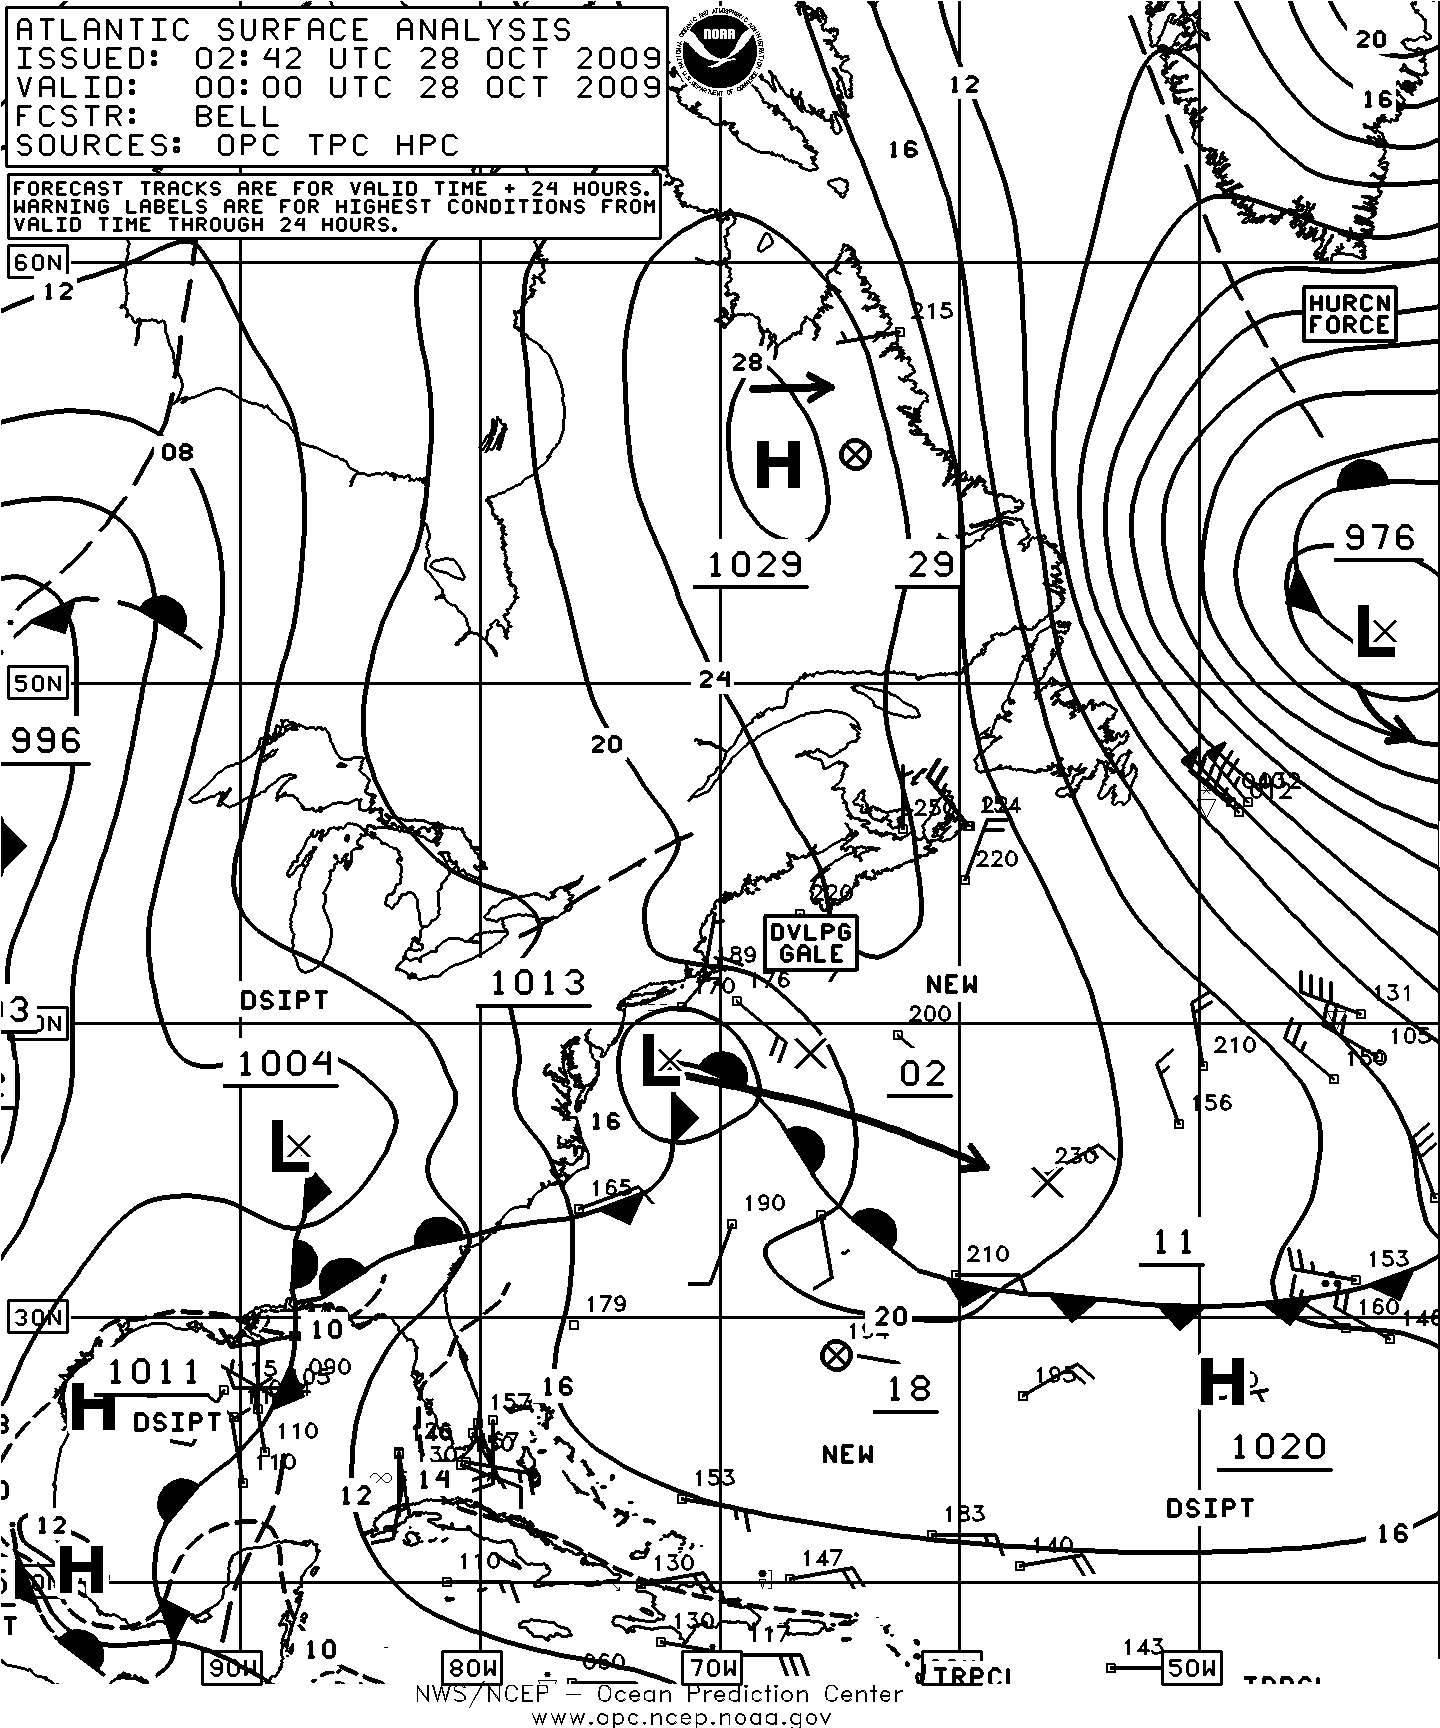
Figure 6. OPC North Atlantic Surface Analysis chart valid 1200 UTC October 19, 2009.
Figure 7. OPC North Atlantic Surface Analysis chart valid 0000 UTC October 28, 2009.
| OBSERVATION | POSITION | DATE/TIME (UTC) | WIND | SEA (m/f) |
|---|---|---|---|---|
| George N (A8PQ5) | 39N 69W | 13/1500 | E 50 | |
| Maersk Kentucky (WKPY) | 37N 74W | 13/1800 | NE 35 | 8.0/27 |
| Buoy 41036 | 34.2N 77.0W | 12/0600 | SE 41 G51 | 5.5/18 |
| Buoy 44009 | 38.5N 74.7W | 12/2100 13/0100 | NE 41 G52 Maximum | 7.0/23 8.0/26 |
| Buoy 44008 | 40.5N 69.2W | 14/0700 14/0800 | E 31 G43 Peak gust | 45 7.0/23 |
| Buoy 44066 | 39.6N 72.6W | 12/1600 13/0900 | NE 35 G45 Maximum | 6.5/21 8.0/26 |
| Buoy 44637 | 40.8N 58.8W | 13/2300 13/2000 | NE 39 G47 NE 30 | 6.0/19 9.0/29 |
| Buoy 44025 | 40.3N 73.2W | 13/0700 | NE 37 G45 5.0/16 14/0000 NE 41 G51 | 5.5/18 |
| Chesapeake Light (C/MAN station CHLV2) | 36.9N 75.6W | 13/0400 | NE 52 G59 Peak gust 72 |
| OBSERVATION | POSITION | DATE/TIME (UTC) | WIND | SEA (m/f) |
|---|---|---|---|---|
| OOCL Norfolk (VREX4) | 47N 31W | 21/1800 | NW 40 | 8.8/29 |
| BATFR49 | 52N 8W | 21/2300 | SW 45 | |
| Atlantic Cartier (SCKB) | 56N 7W | 22/1800 | W 80 | 17.5/57 |
| Nedlloyd Valentina (A8EG9) | 47N 6W | 22/1300 | W 35 | 9.8/32 |
| BATFR03 | 50N 1W | 22/1300 | W 55 | |
| Buoy 62092 | 51.2N 10.4W | 21/1800 22/1100 | SW 35 W 30 | 7.3/24 12.5/41 |
| Buoy 62081 | 51N 13.3W | 22/0900 | Maximum | 13.1/43 |
| Buoy 62095 | 53.1N 15.8W | 22/0000 22/0700 | SW 45 Maximum | 10.7/35 13.4/44 |
| Buoy 62093 | 55N 9.9W | 22/1000 22/1200 | SW 40 Maximum | 10.1/33 10.7/35 |
| Buoy 62023 | 51.4N 7.9W | 22/1500 | W 50 | 7.6/25 |
Western Atlantic Storm, December 1-3: Originating as a frontal wave south of Nova Scotia early on the 1st, the cyclone developed rapidly as it passed north across the island of Newfoundland early on the 2nd. The central pressure fell 32 hPa in the twenty-four hour period ending at 1200 UTC on the 2nd. The cyclone developed a maximum intensity of 960 hPa off the central Labrador coast six hours later when OPC briefly classifi ed it as a hurricaneforce low. The platform HIBERNIA (VEP717, 46. 7N 48. 7W) at 1500 UTC on the 1st reported a southwest wind of 58 KT. TERRA NOVA platform (VCXF, 46.4N 48. 4W) at 0900 UTC on the 3rd reported west winds of 47 KT. The system then turned toward the southeast and weakened rapidly on the 3rd as a new storm passed to the south cyclone moving north toward the eastern Greenland waters by the 4th.
North Atlantic Storms, December 5-10: Figure 14 shows the development of this major system from a frontal wave of low pressure off the New England coast over a thirty-six hour period. The central pressure fell 35 hPa in the twenty-four hour period ending at 1200 UTC on the 7th. The second part of Figure 14 depicts the cyclone at maximum intensity with a central pressure of 942 hPa (27.82 inches), making it the most intense of the four-month period. The ASCAT imagery in Figure 15 reveals west winds of up to 70 KT on the south side, which is remarkable since winds this high appearing on ASCAT relatively rare with its low bias relative to QuikSCAT. Hurricane-force winds with this system lasted from late on the 6th to 0000 UTC on the 8th. Some notable ship, buoy and platform reports from this storm are listed in Table 5. The cyclone subsequently drift ed northeast over the next day before turning subsequently drift ed northeast over the next day before turning northwest and weakening east of Greenland on the 9th and 10th. Meanwhile a developing secondary cyclone moved from south of Newfoundland early on the 8th to the central North Atlantic by 0600 UTC on the 10th where it briefly developed hurricane-force winds and a central pressure as low as 972 hPa. This system turned north and replaced the preceding system that was weakening near Greenland, briefly redeveloping hurricaneforce winds early on the 10th in the waters east of Greenland and becoming similar to the cyclone seen near Greenland in the second part of Figure 12. The cyclone then dissipated late on the 11th
Southwestern North Atlantic Storm, December 19-22: This developing cyclone was already a gale as it moved out of the Gulf of Mexico and into the southeastern U.S. coastal waters and within twenty-four hours became a hurricane-force 968 hPa low just east of Georges Bank (Figure 16). A 50-km ASCAT pass from 0140 UTC December 21 shows winds as high as 50 KT south of the center but due to low bias at higher wind speeds these winds could be enough for the hurricane-force label. The INDEPENDENCE II (WGAX) reported northeast winds of 50 KT and 9.5-meter seas (31 feet) near 40N 69W at 0900 UTC on the 20th. The BRITISH HARMONY (MHMZ8) encountered west winds of 55 KT and 10.7-meter seas (35 feet) near 41N 67W at 1800 UTC on the 20th and six hours later the INTEGRITY (WDC6925) reported northwest winds of 50 KT near 38N 70W. The buoy 44024 (42.3N 65.9W) reported at 1800 UTC on the 20th a northeast wind of 35 KT and 8.0-meter seas (26 feet) followed three hours later by a report of seas 10. 0 meters (33 feet). The cyclone subsequently moved east over the next day before turning southeast with a weakening trend, and dissipating south of the Azores Islands on the 25th.
North Atlantic Storm, December 25- 30: This developing storm originated south of Nova Scotia on the 24th and moved east along 39N with Figure 18 showing the fi nal development of the western 998-hPa low over a thirty-six hour period. The central pressure fell 26 hPa in the twentyfour hour period ending at 1200 UTC on the 26th, when the cyclone was at maximum intensity. The high-resolution ASCAT image in Figure 19 shows a swath of 42 KT or higher winds around the west and north sides of the cyclone with the highest 55 KT, but a data-free swath between passes might miss some stronger winds. Some ship and buoy observations taken in this storm are listed in Table 6. The cyclone then turned northeastward over the next two days before looping off western Europe and weakening over northwest Spain on the 31st.
Northwest Atlantic Storm, December 30-31: Originating in the Gulf of Maine late on the 28th, low pressure initially deepened rapidly as it moved across the Gulf of St. Lawrence on the 29th and then re-formed to the north toward the Davis Strait on the 30th. An ASCAT pass from mid-day on the 30th revealed 50-KT southeast winds off the southwest Greenland coast. OPC briefly analyzed this as a hurricane-force wind event later that day. The cyclone stalled and dissipated on the 31st galeforce by the end of the month. with winds diminishing to below gale-force by the end of the month.
References
- ASCAT Users Manual
- Tropical Cyclone Reports, 2009 Atlantic Hurricane Season, National Hurricane Center
- E-mail communication, Thomas, Bridget, Climate Data and Analysis Section(Environment Canada) through Robert Luke (NDBC), September 17, 2007.
- Von Ahn, Joan. and Sienkiewicz, Joe, Hurricane Force Extratropical Cyclones Observed Using QuikSCAT Near Real Time Winds, Mariners Weather Log, Vol. 49, No. 1, April 2005.
- Saffir-Simpson Scale of Hurricane Intensity
Figure 8. High-resolution QuikSCAT scatterometer image of satellite-sensed winds around the hurricaneforce storm shown in the second part of Figure 8. The valid time of the pass is 0855 UTC October 27, 2009, or about fi fteen hours prior to the valid time of the second part of Figure 8. The center of the storm appears near 58N 56W implying that the cyclone was heading southeastward in the Labrador Sea. Image is courtesy of NOAA/NESDIS/Offi ce of Research and Applications.
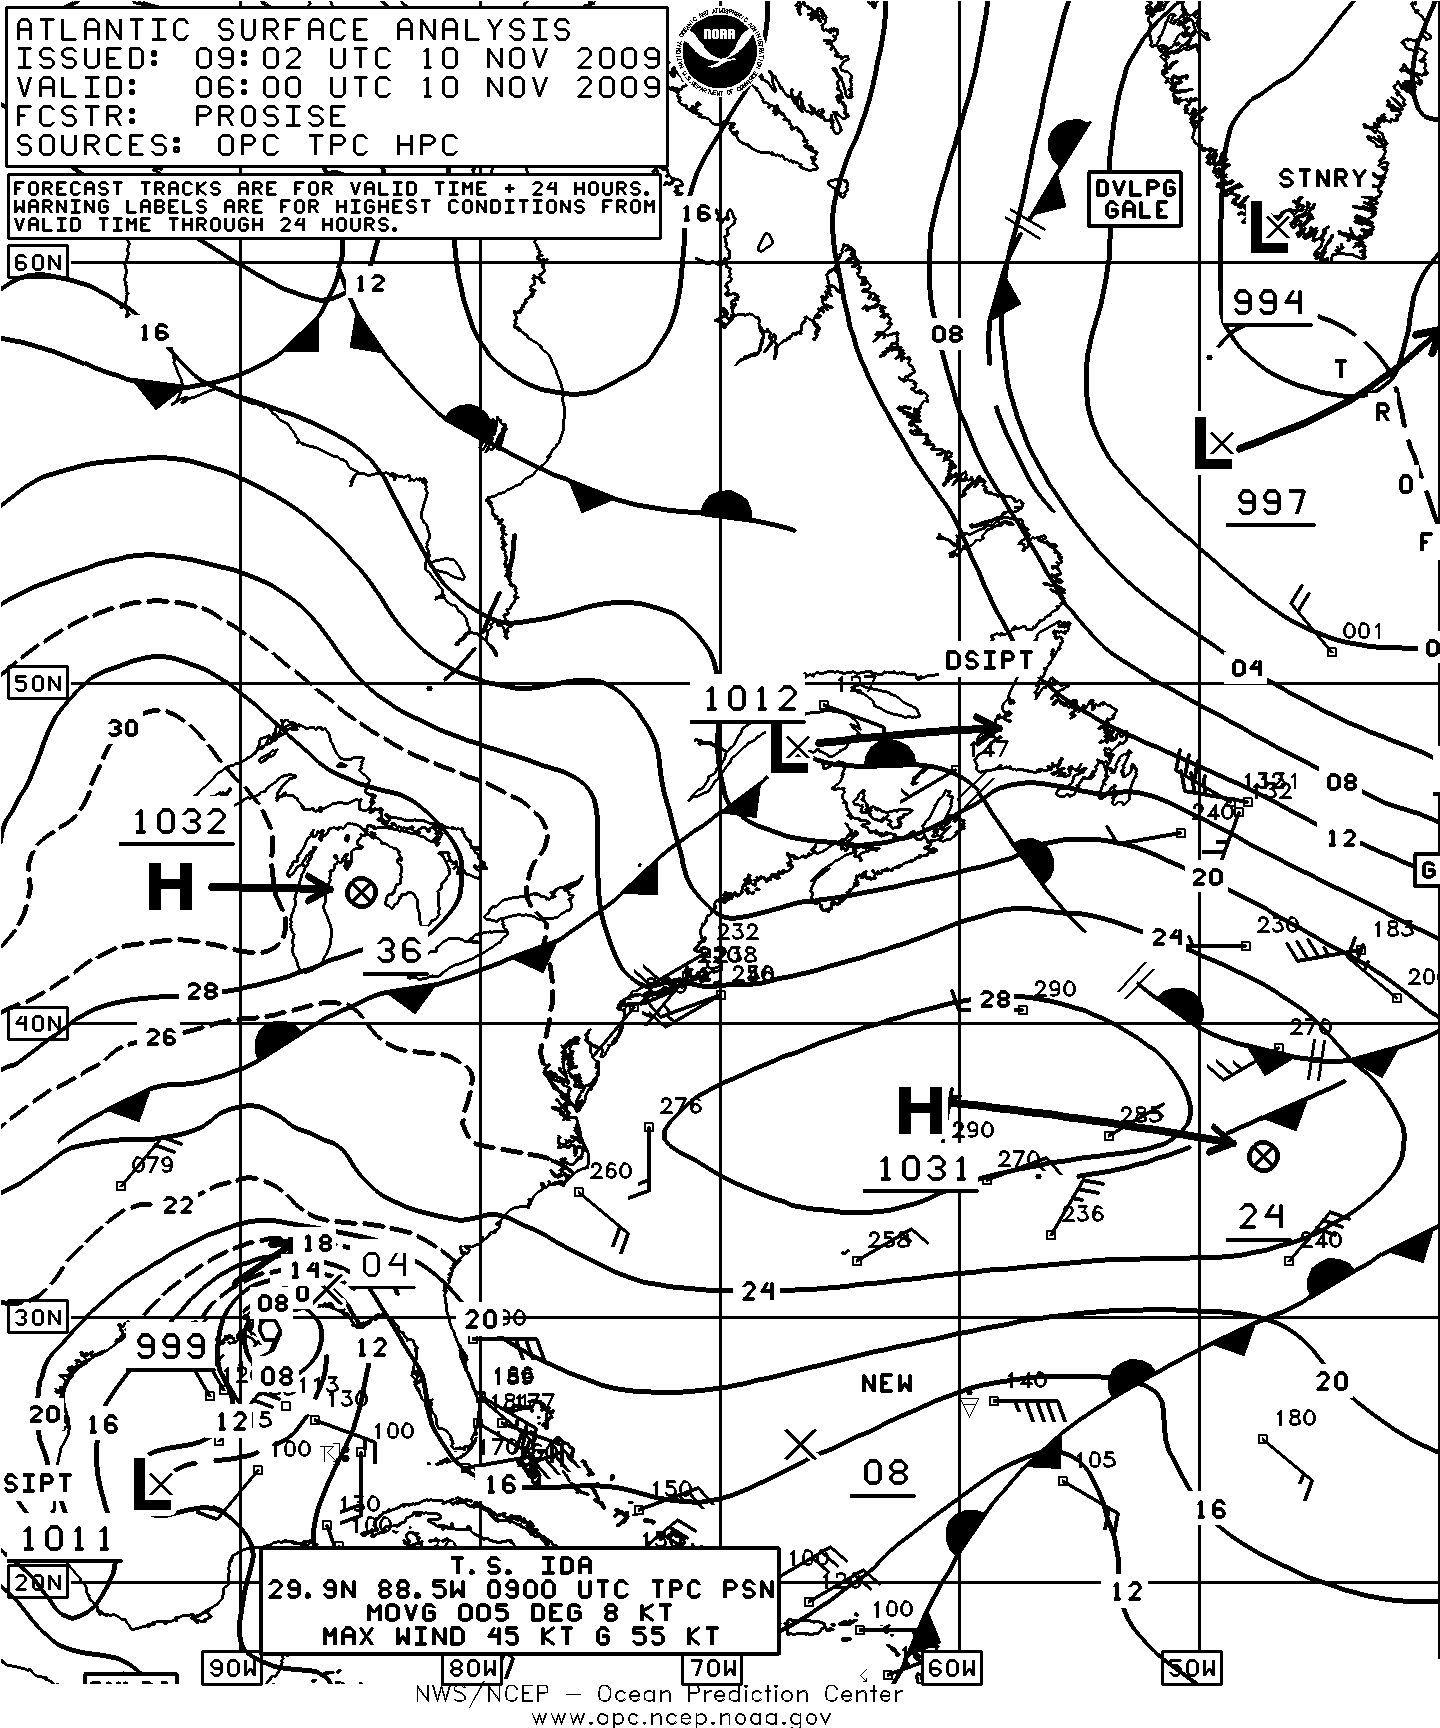
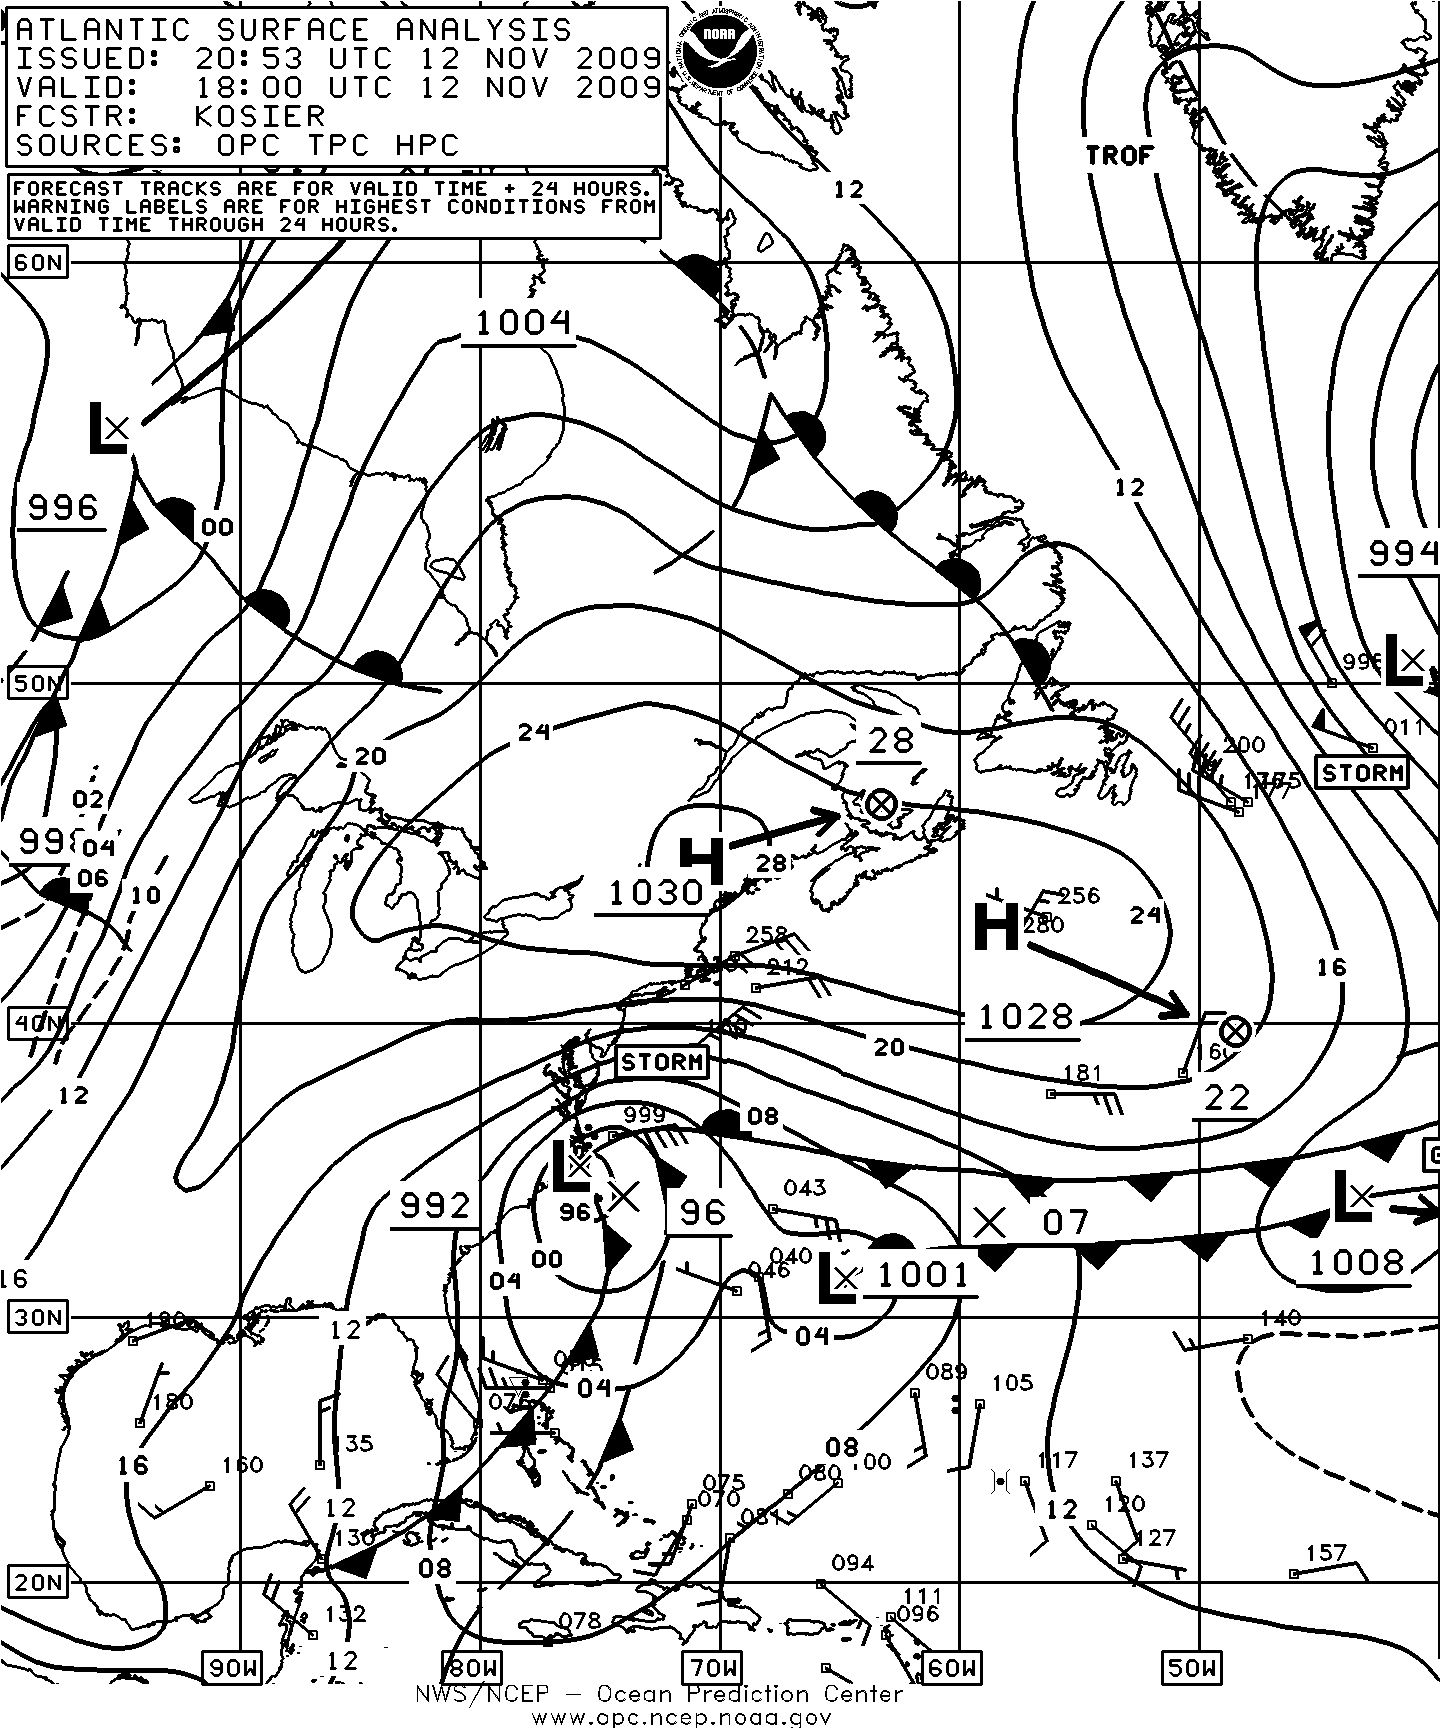
Figure 9. OPC North Atlantic Surface Analysis charts (Part 2) valid 0600 UTC November 10 and 1800 UTC November 12, 2009.
Figure 10. High-resolution QuikSCAT scatterometer image of satellite-sensed winds around the storm shown in Figure 10. The valid time of the pass is 2343 UTC November 13, 2009, or about thirty hours later than the valid time of the second part of Figure 10. The cyclone was drifting southeast off Cape Hatteras during this period, with the center of the storm appearing near 33N 74W near the western edge of the image. Image is courtesy of NOAA/NESDIS/Offi ce of Research and Applications.
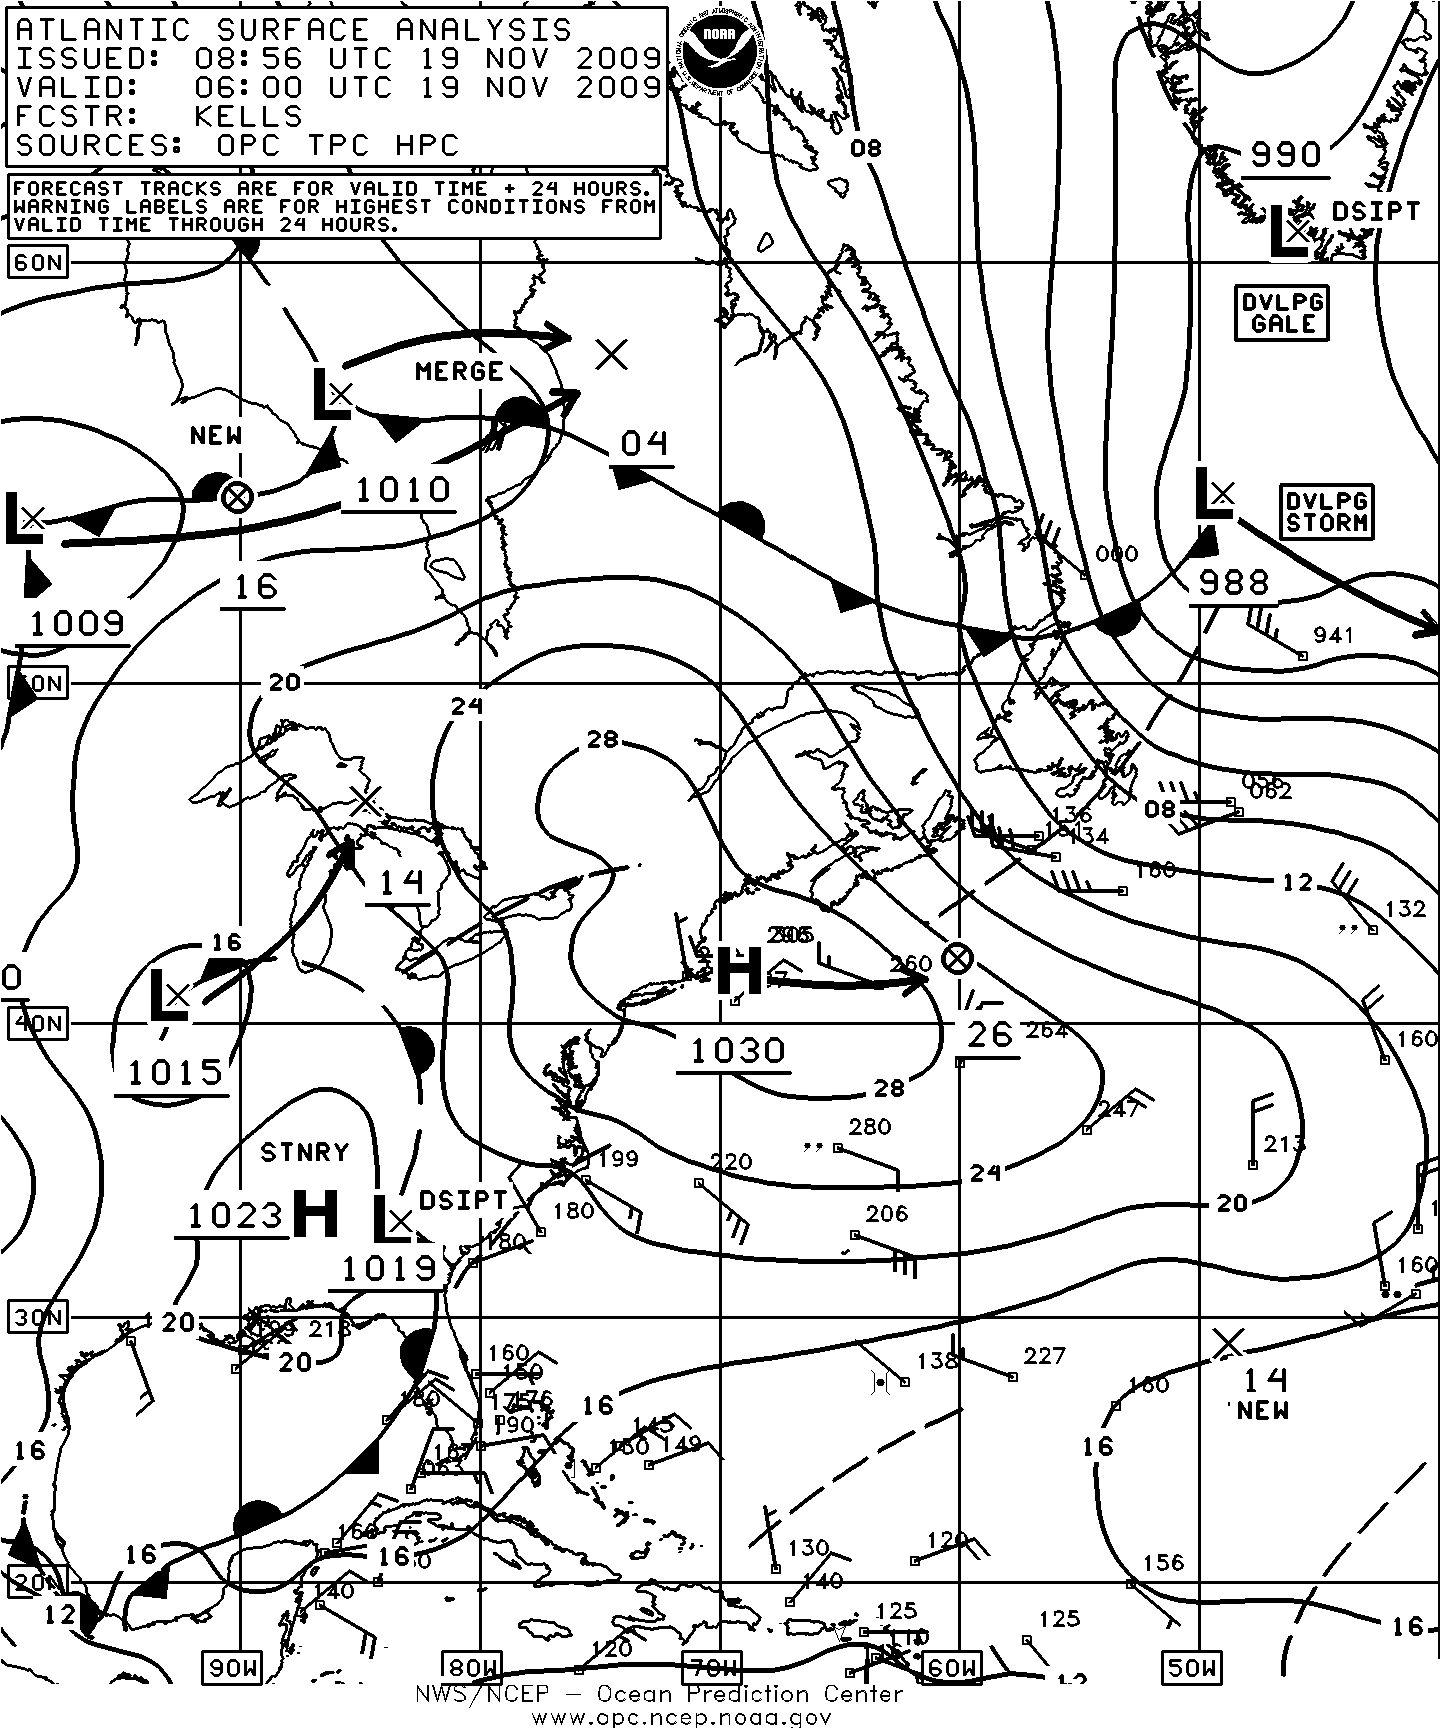
Figure 11. OPC North Atlantic Surface Analysis charts valid 0600 UTC November 19 (Part 2) and 1800 UTC November 21, 2009 (Part 1).
Figure 12. High-resolution QuikSCAT scatterometer image of satellite-sensed winds around the hurricane-force low shown in the second part of Figure 12. The valid time of the pass is 2009 UTC November 21, 2009, or about two hours later than the valid time of the second part of Figure 12. The center of the storm is near 55N 20W near the center of the image. Image is courtesy of NOAA/NESDIS/Offi ce of Research and Applications.
| OBSERVATION | POSITION | DATE/TIME (UTC) | WIND | SEA (m/f) |
|---|---|---|---|---|
| Independent Pursuit (A8FC6) | 38N 70W | 06/0600 | SW 45 | 7.3/24 |
| APL Agate (WDE8265) | 39N 57W | 06/1200 | SW 45 | 11.3/37 |
| Maersk Iowa (KABL) | 41N 65W | 06/1200 | W 50 | 8.5/28 |
| Hoechst Express (DHER) | 45N 59W | 06/2100 | N 50 | |
| Sea-Land Meteor (WDB9951) | 48N 47W | 07/1200 | W 50 | 8.2/27 |
| Buoy 44637 | 40.8N 58.3W | 06/1200 | SW 45 | |
| Buoy 44140 | 42.9N 51.4W | 07/0000 07/0300 | W 50 Maximum | 9.0/30 10.0/33 |
| Buoy 44138 | 44.3N 53.6W | 07/0000 07/0400 | NW 45 Maximum | 5.5/18 9.0/30 |
| Hibernia (VEP717) | 46.7N 48.7W | 07/0900 07/1200 | NW 58 NW 50 | 7.0/23 |
| Terra Nova (VCXF) | 46.4N 48.4W | 07/0900 | NW 63 | 8.2/27 |
| OBSERVATION | POSITION | DATE/TIME (UTC) | WIND | SEA (m/f) |
|---|---|---|---|---|
| Washington Express (WDD3826) | 37N 47W 37N 49W | 26/1200 26/0600 | NW 62 N 52 | 8.2/27 9.4/31 |
| M/V Geysir (WCZ5528) | 40N 48W | 26/1800 | NE 60 | 14.9/49 |
| Benguela Stream (PENR) | 39N 39W | 27/1500 | N 50 | 12.2/40 |
| Philadelphia Express (WDC6736) | 41N 41W | 27/1500 | N 44 | 11.0/36 |
| Tamesis (LAOL5) | 48N 42W | 27/1800 | NW 50 | |
| Buoy 44637 | 38.1N 54.4W | 25/1500 | N 55 |
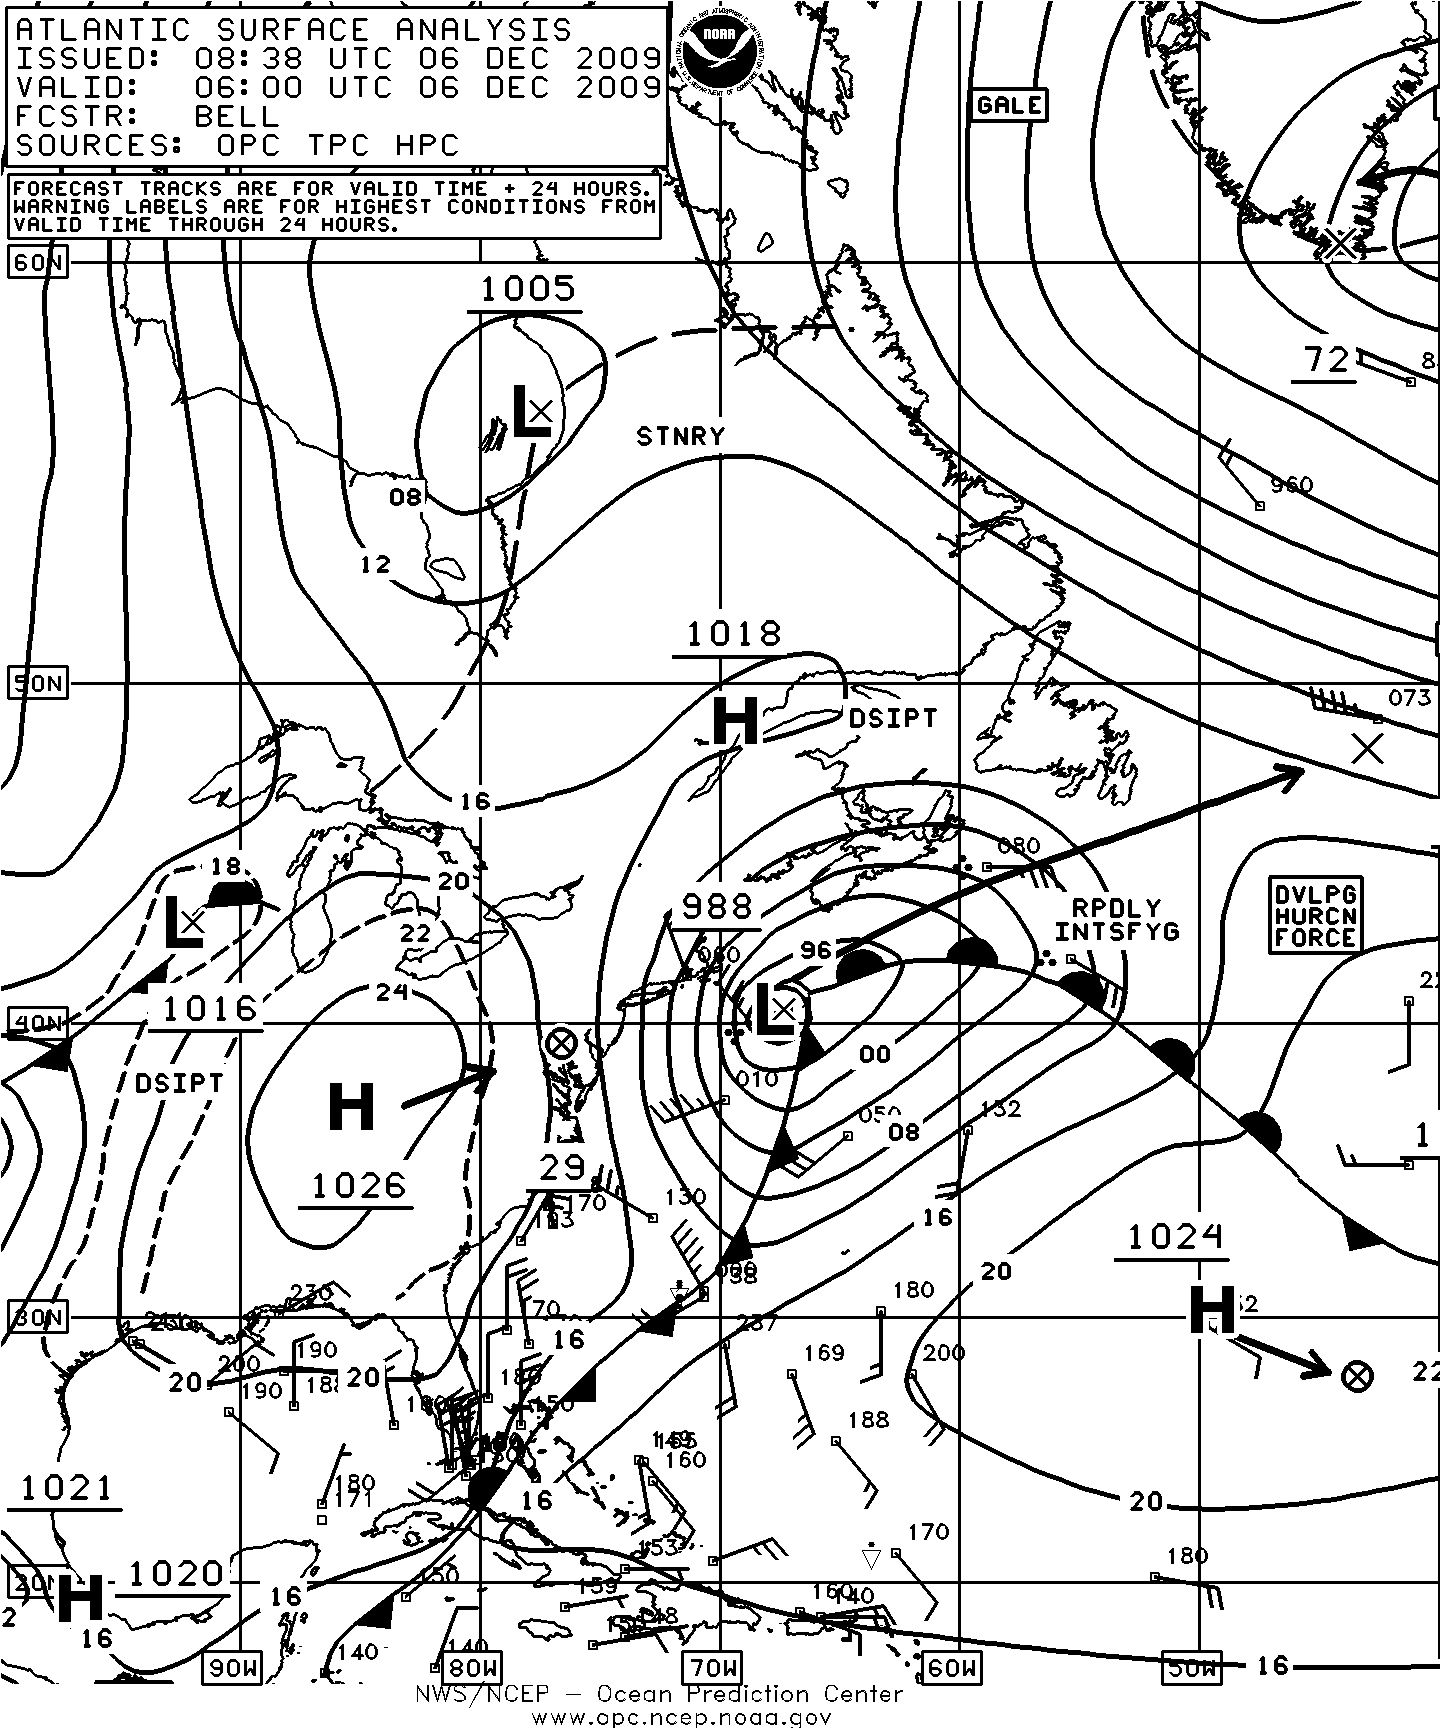
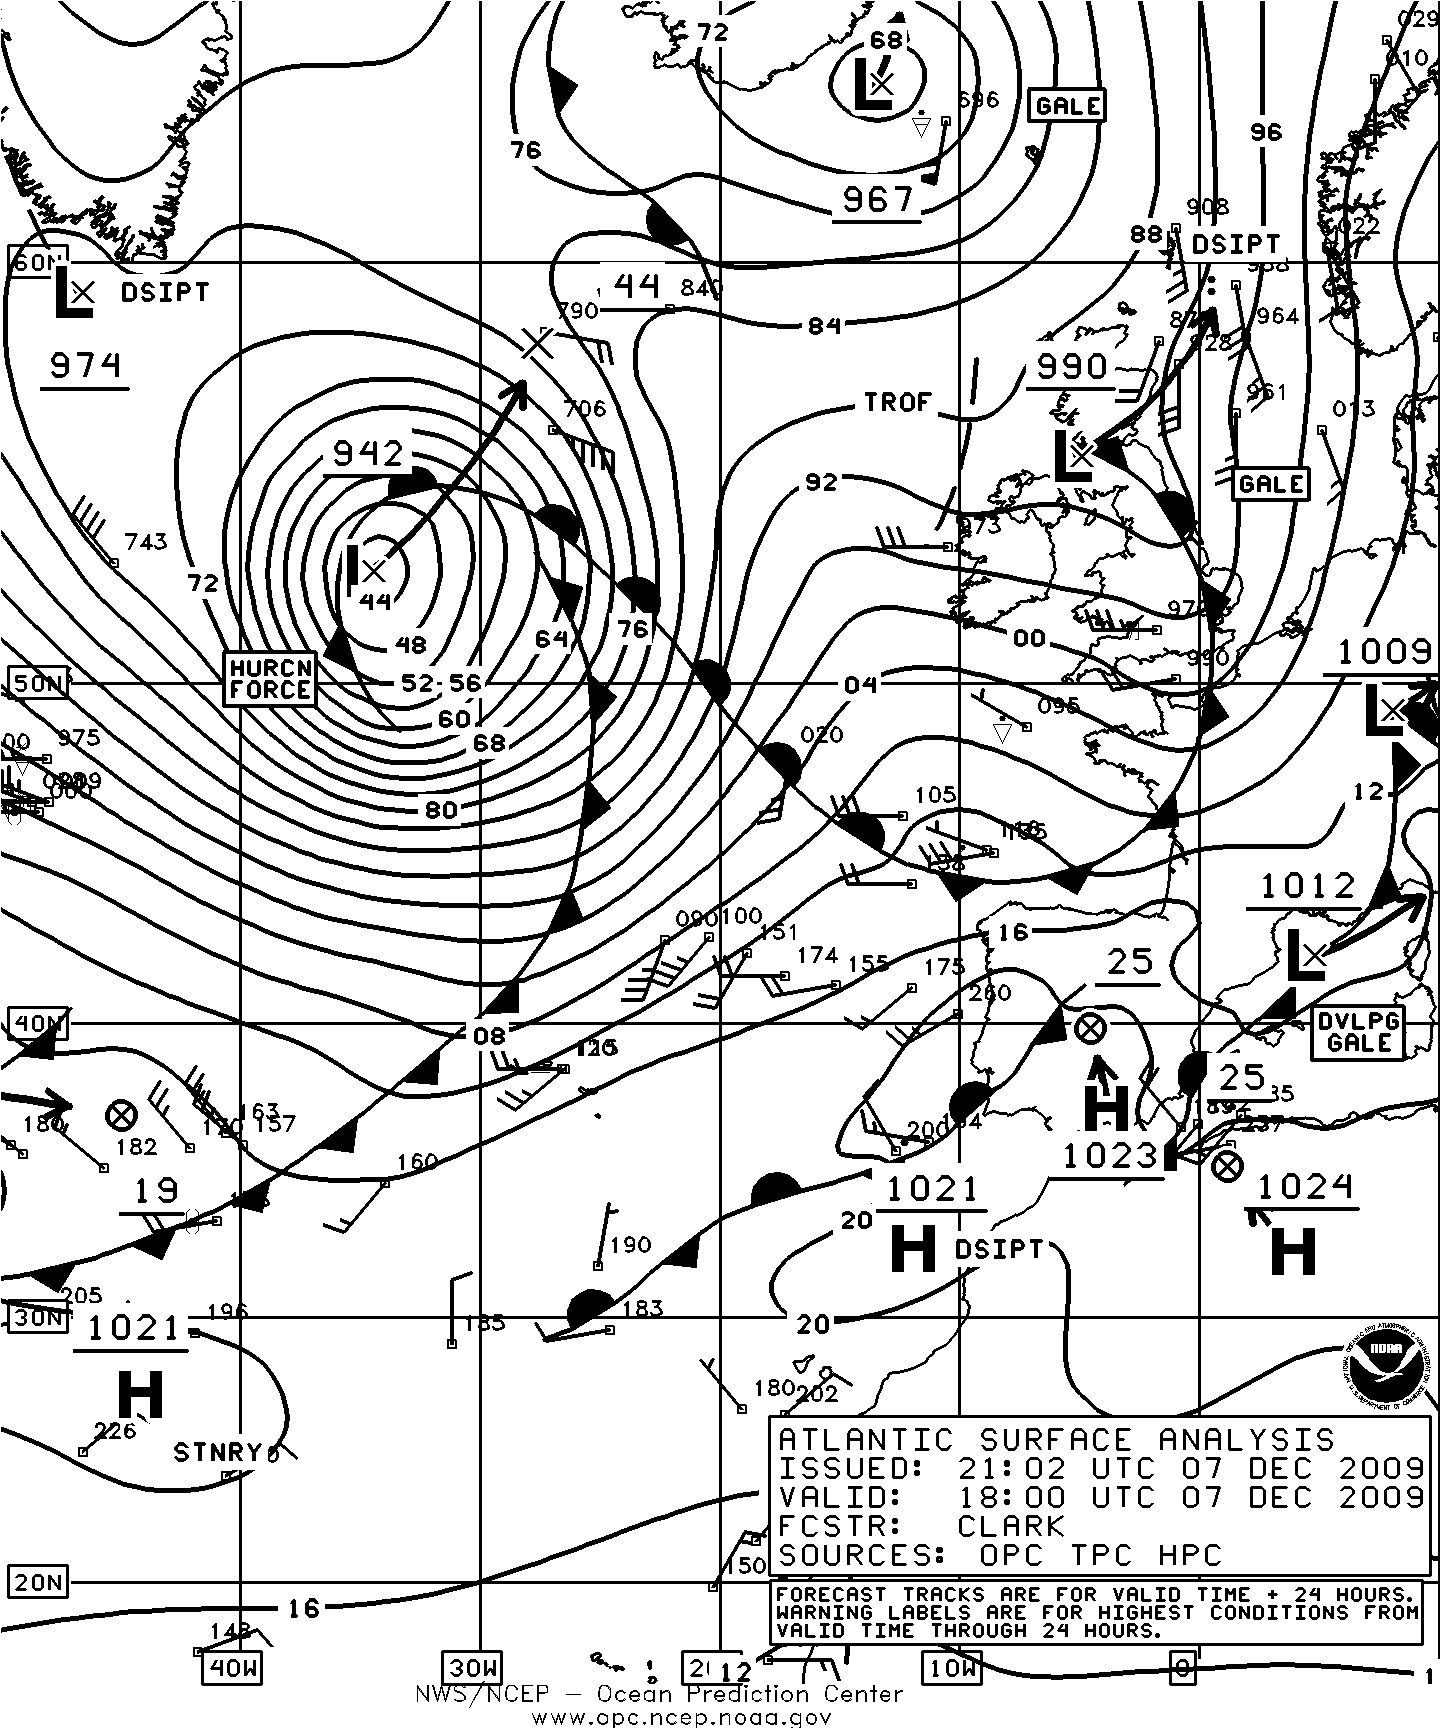
Figure 13. OPC North Atlantic Surface Analysis charts valid 0600 UTC December 6 (Part 2) and 1800 UTC December 7, 2009 (Part 1).
Figure 14. 50-km ASCAT (Advanced Scatterometer) image of satellite-sensed winds around the hurricane-force low shown in the second part of Figure 14. The western portion of the 1203 UTC pass and the eastern portion of the 1345 UTC pass, for December 7, 2009, are shown, with the passes overlapping north of 50N. These times are about four to six hours prior to the valid time of the second part of Figure 14. The center of the storm is near 52N 38W in right-center portion of the image. Image contains data processed by NOAA/NESDIS.
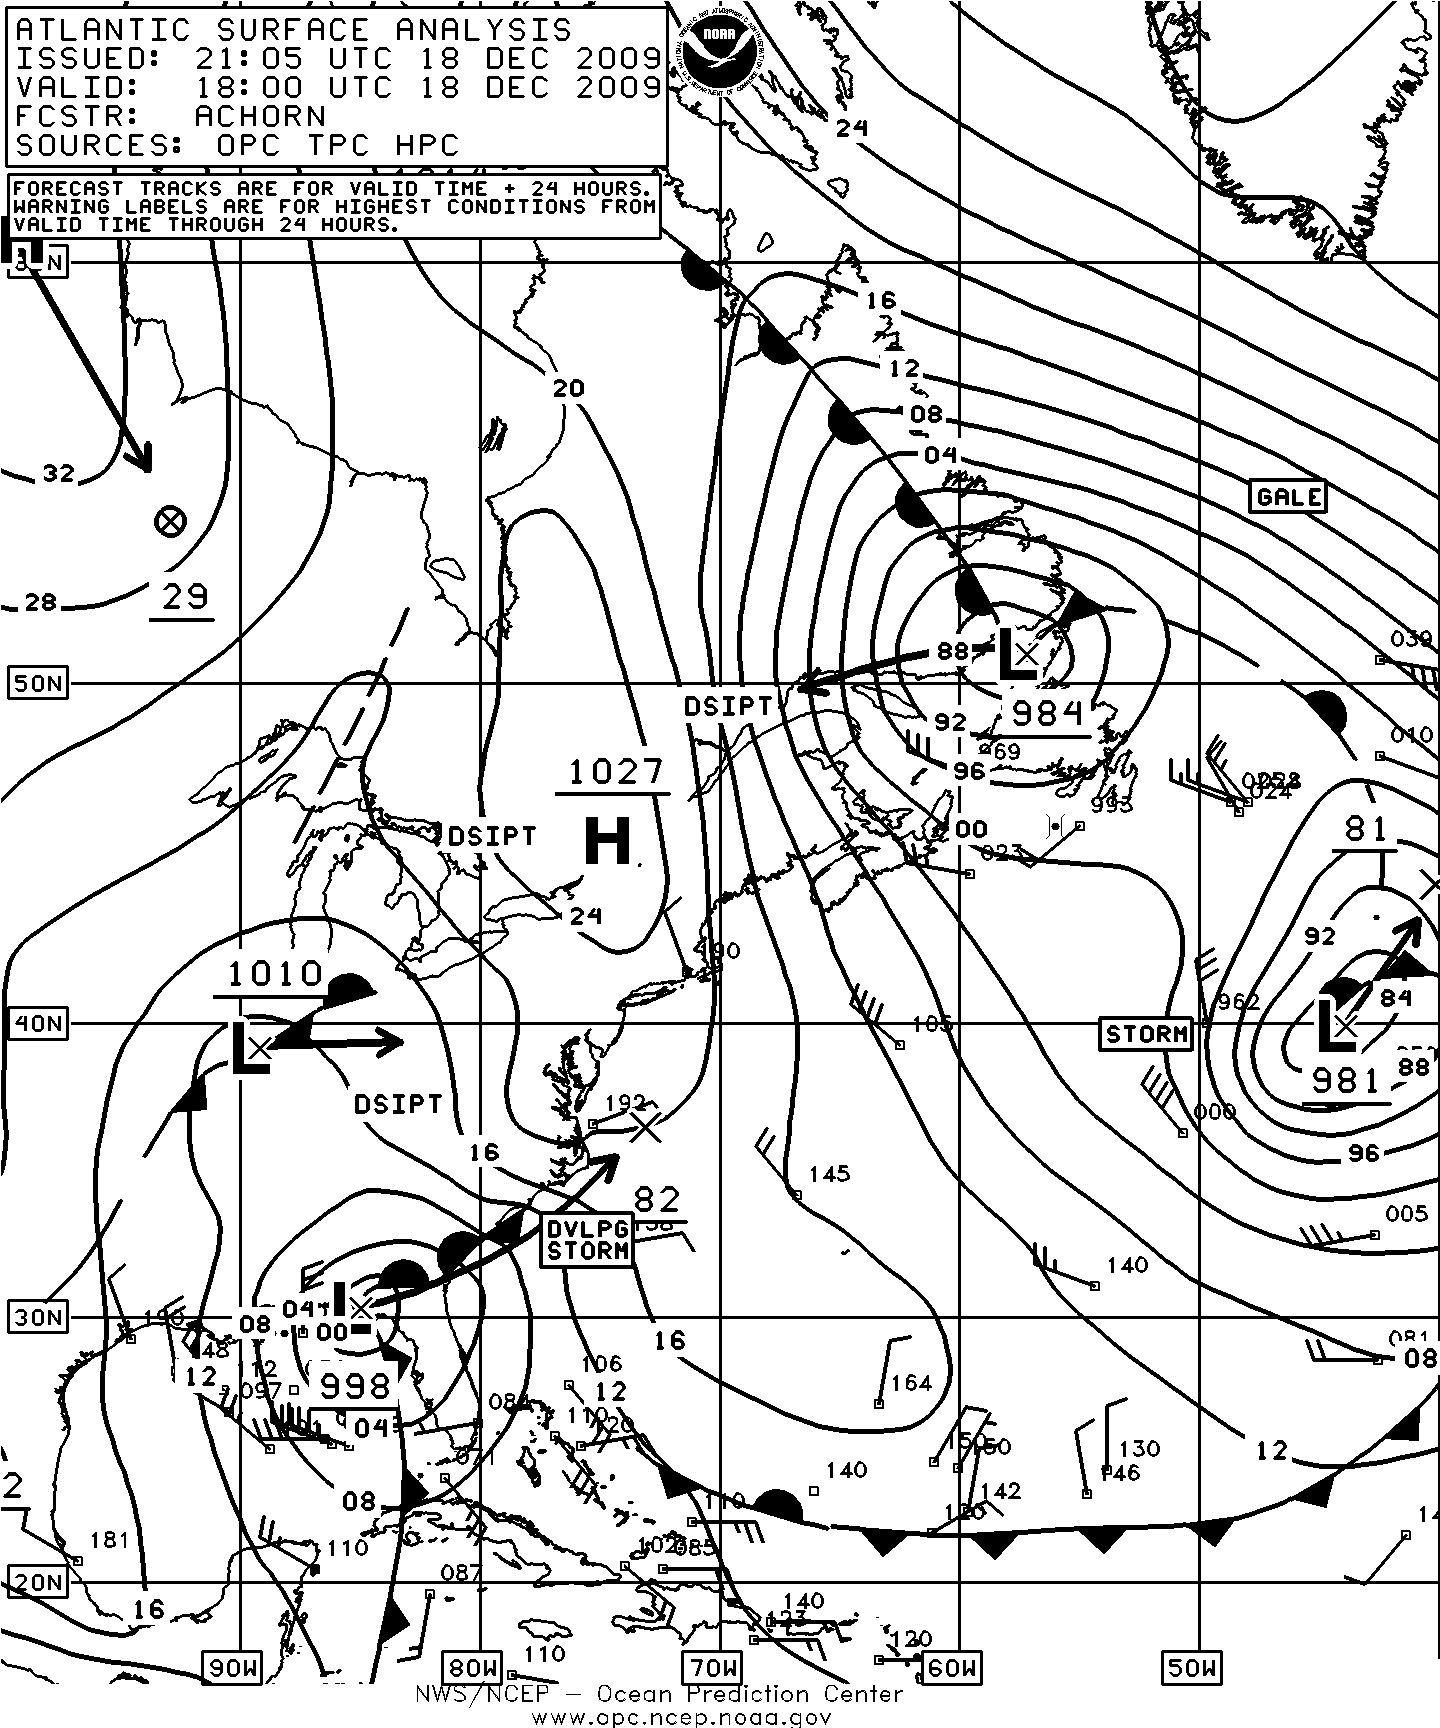
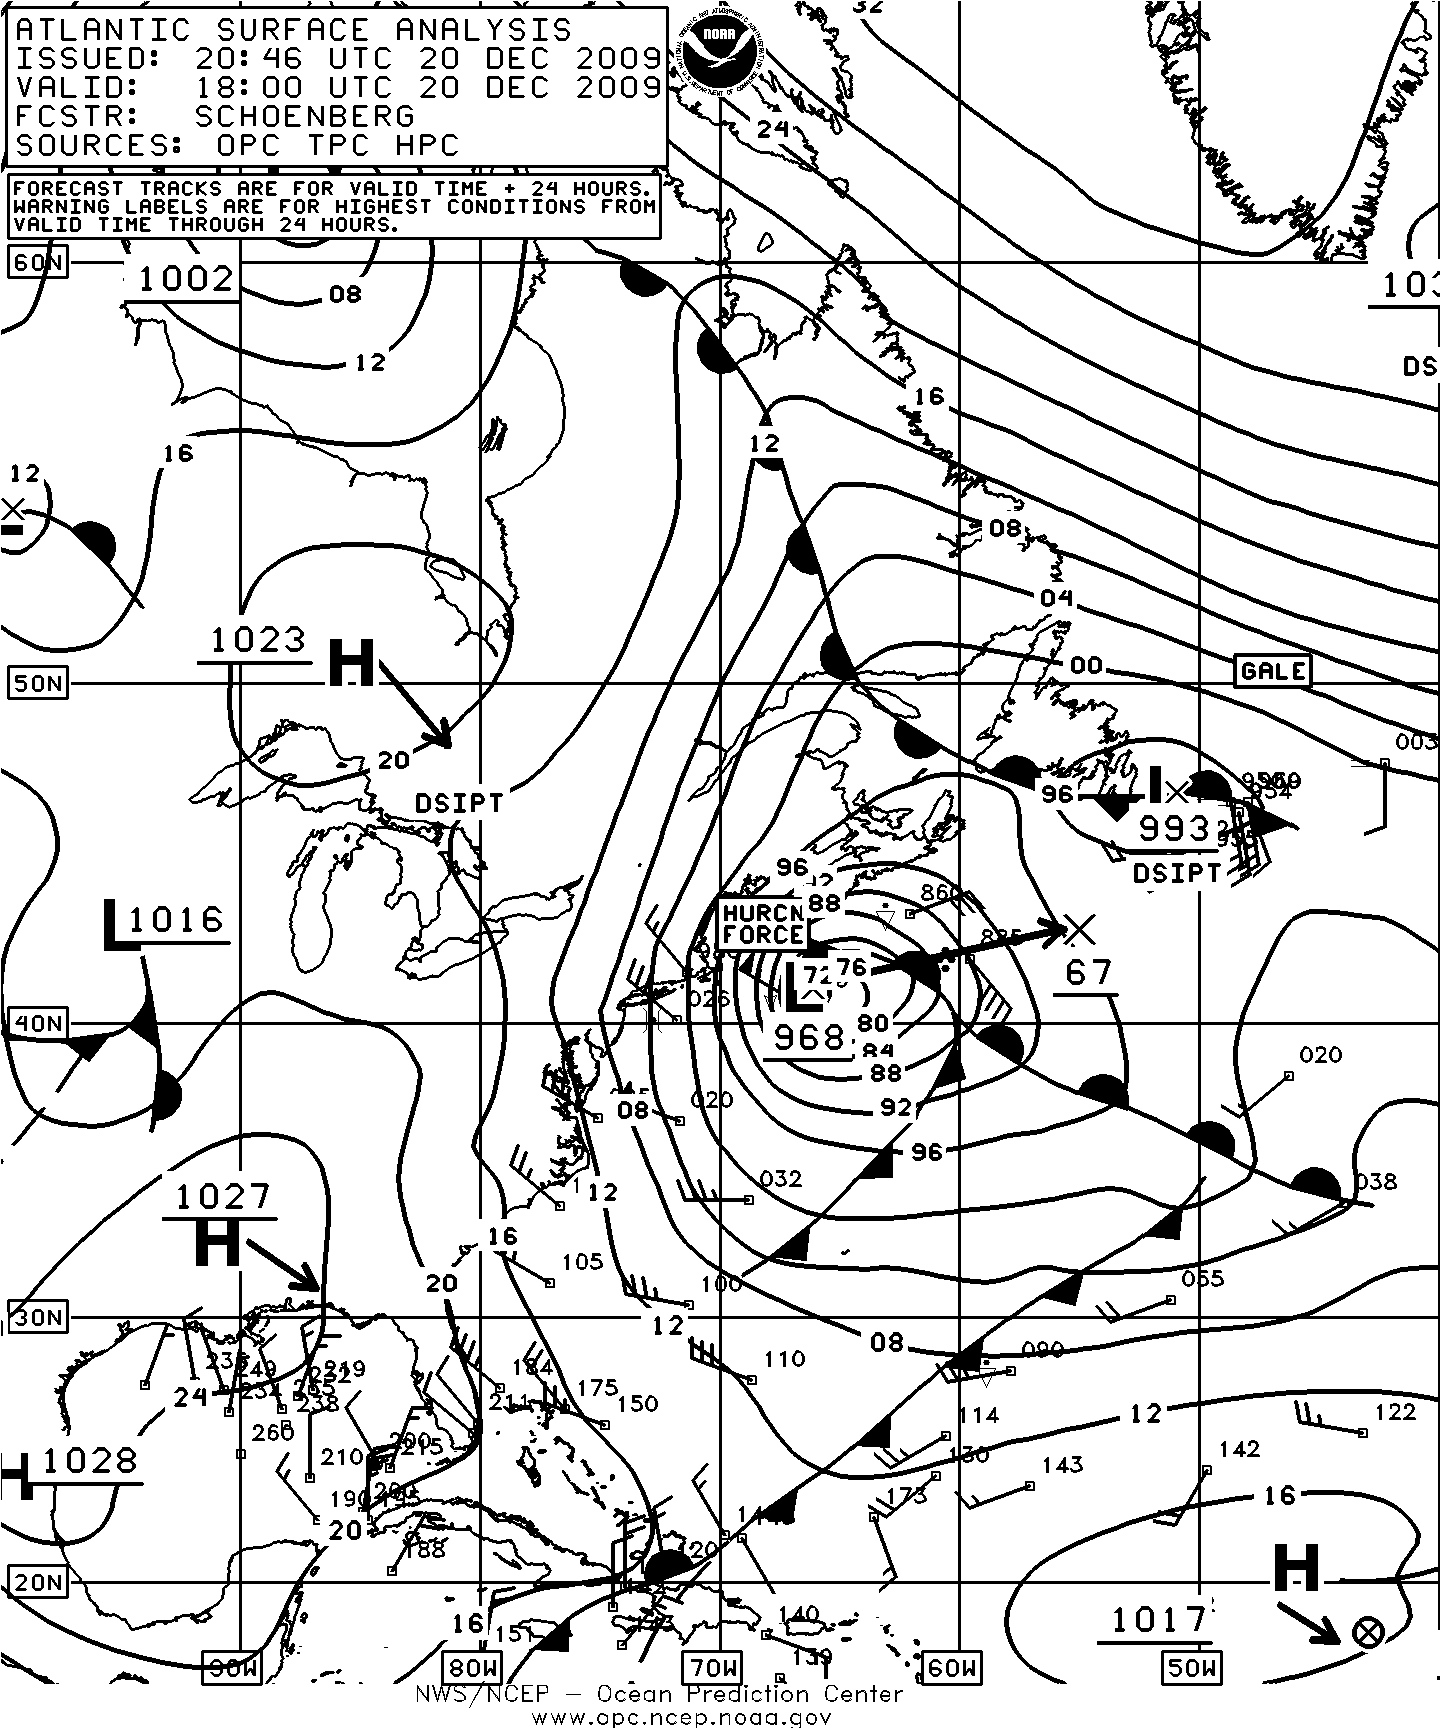
Figure 15. OPC North Atlantic Surface Analysis charts (Part 2) valid 1800 UTC December 18 and 20, 2009.
Figure 16. 50-km ASCAT (Advanced Scatterometer) image of satellite-sensed winds around the hurricane-force low shown in the second part of Figure 16. A small portion of the pass with valid time 0142 UTC December 21, 2009 is shown, or about seven and three-quarters hours later than the valid time of the second part of Figure 16. A well-defi ned storm center appears near 42N 62W. Image contains data processed by NOAA/NESDIS.
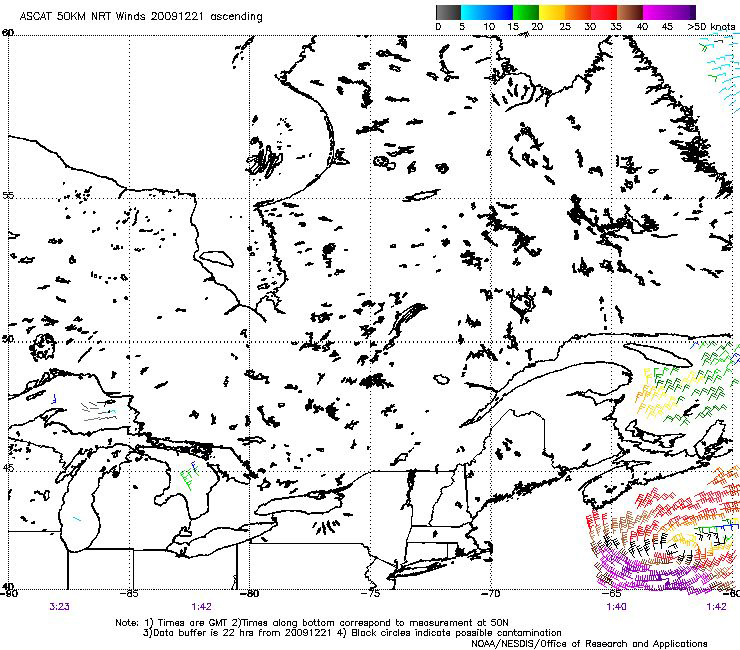
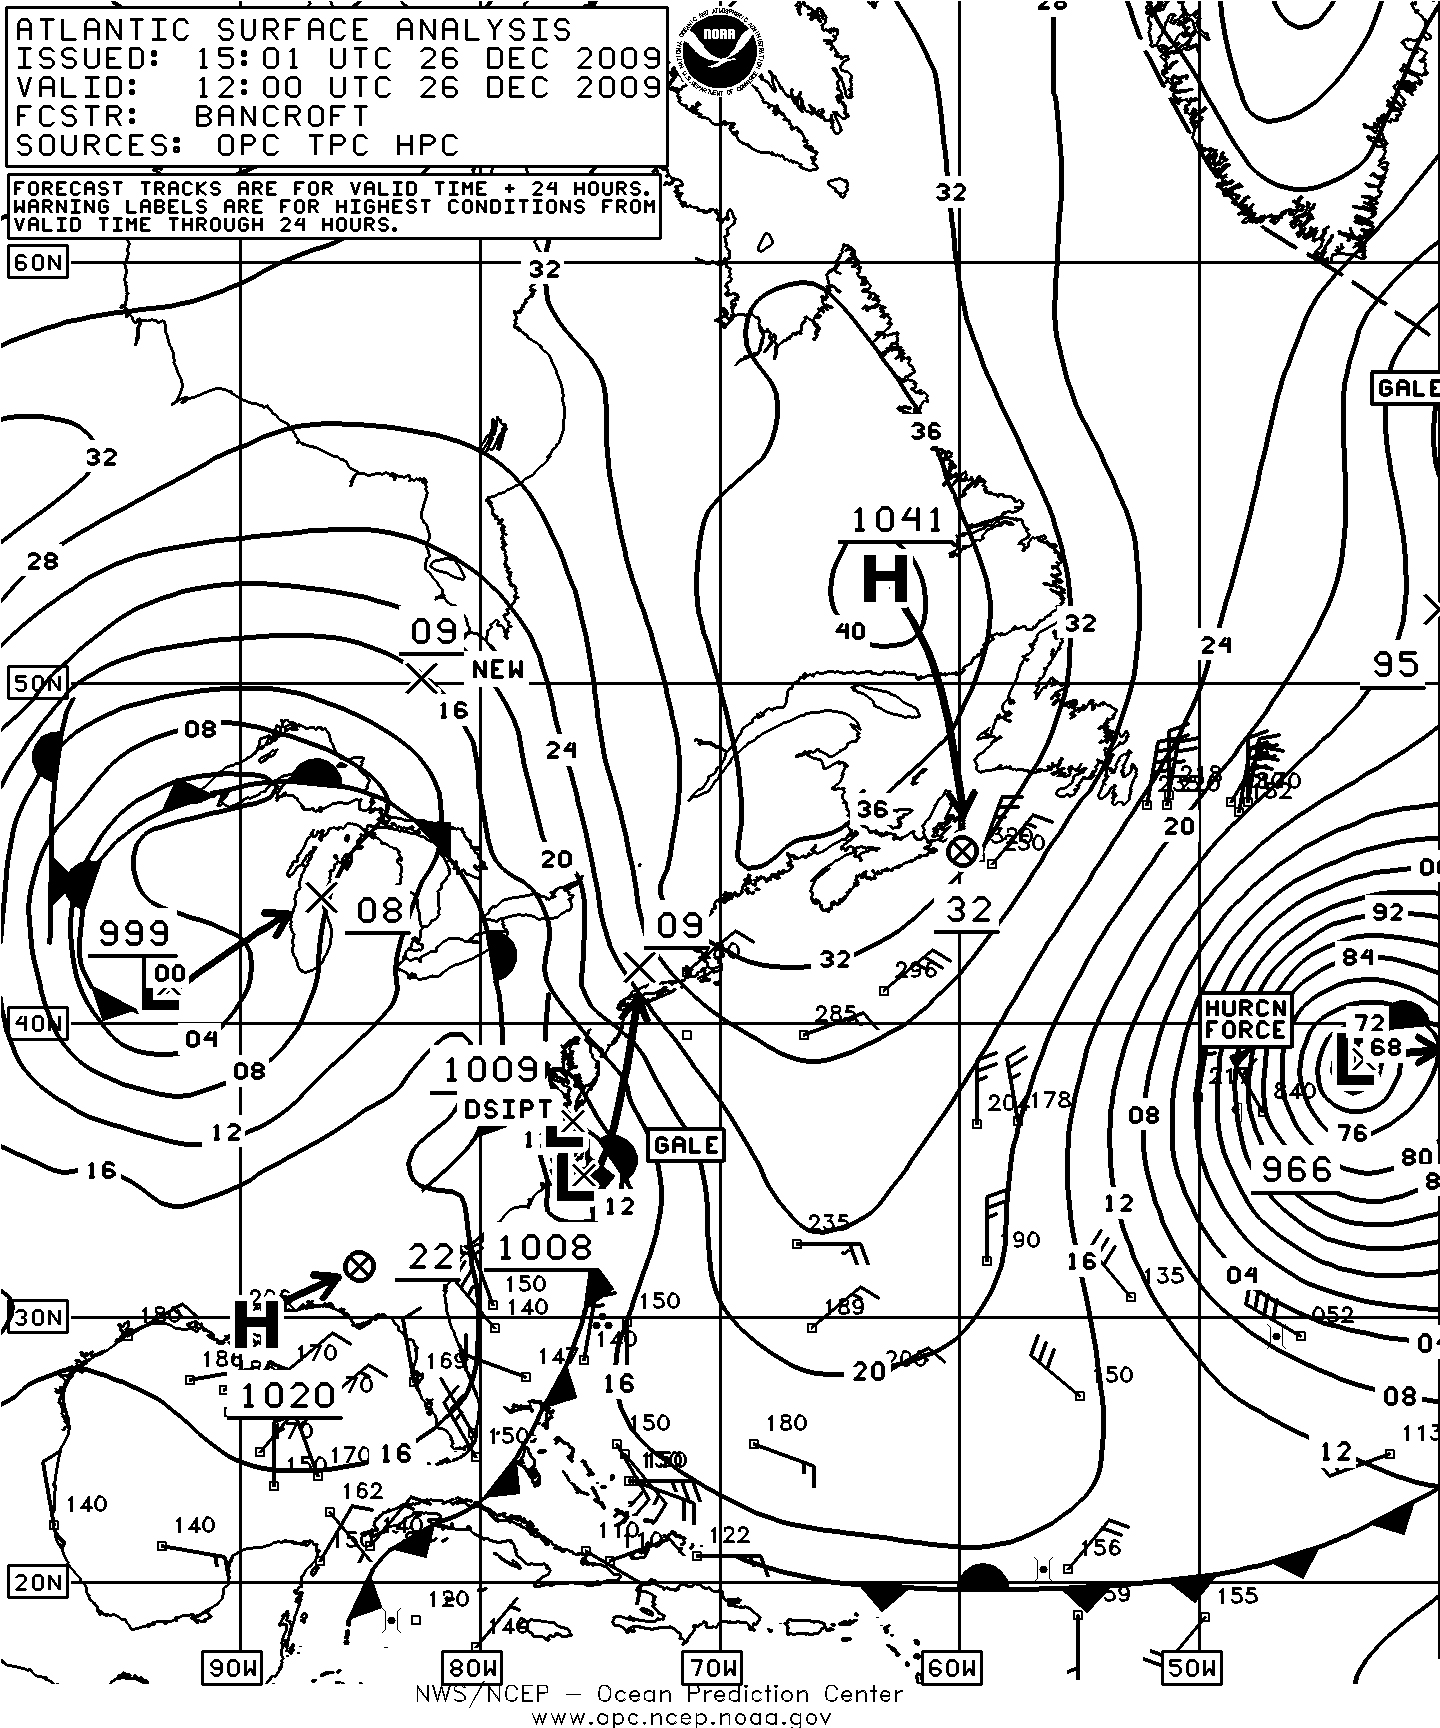
Figure 17. OPC North Atlantic Surface Analysis charts valid 0000 UTC December 25 and 1200 UTC December 26, 2009.
Figure 18. High-resolution ASCAT (Advanced Scatterometer) image of satellite-sensed winds around the hurricane-force low shown in the second part of Figure 18. The resolution is 25 km versus the coarser 50-km version such as in Figure 17. Portions of adjacent passes (approximately 1213 UTC and 1353 UTC December 26, 2009) are shown along with numbered cross-track time lines of the satellite, with these times less than two hours later than the valid time of the second part of Figure 18. The storm center appears in the eastern pass near 39N 41W. The image is specially adapted for OPC operational use.
Back to top